person

Designing BI Dashboard for Enhanced Decision-Making at DIRECTV

Role: Senior Product Designer
Company: DIRECTV
Duration: June 2018 - November 2020
Tools: Microstregy, Power BI, IBM Cogno, Figma, JIRA, UserTesting
Team: Product Managers, Data Engineers, UX/UI Designers, QA Analysts (10 people total)

Project Overview

At DIRECTV, multiple business units were using Business Intelligence (BI) tools that lacked design consistency, clarity, and usability, resulting in poor user engagement and inefficiencies in decision-making. The primary goal of the project was to redesign the BI dashboards to improve navigation, enhance data visualizations, and make them more adaptable to the needs of different teams, while aligning with the company’s broader strategy of becoming more data-driven


team member

Strategic Leadership Highlights

Business Challenge & Vision

As a Senior Product Designer at DIRECTV, I observed that the existing BI dashboards were not serving the needs of various internal teams effectively. These teams were facing challenges in navigating through overly complex visualizations and inconsistent data views. My goal was to simplify and streamline the user experience, allowing teams to quickly access relevant insights without being overwhelmed by excessive or irrelevant data. I worked closely with product managers and data engineers to identify specific user needs and developed a vision for a more intuitive, user-friendly dashboard.

team member

Collaboration and Stakeholder Engagement

• Cross-Functional Collaboration: I worked alongside a team of 10, including product managers, data engineers, UI/UX designers, and QA analysts. My role involved translating complex user needs into actionable design strategies while ensuring close collaboration with engineers to ensure design feasibility. 

• Stakeholder Engagement: I facilitated regular discussions with business stakeholders from different departments, including marketing, operations, and finance, to gather their requirements. This ensured that the design would support the diverse needs of internal users, making the tool adaptable to various roles within the company.

team member

BI User Type


team member

SAS Enterprise Production Retire


Design Strategy & Process

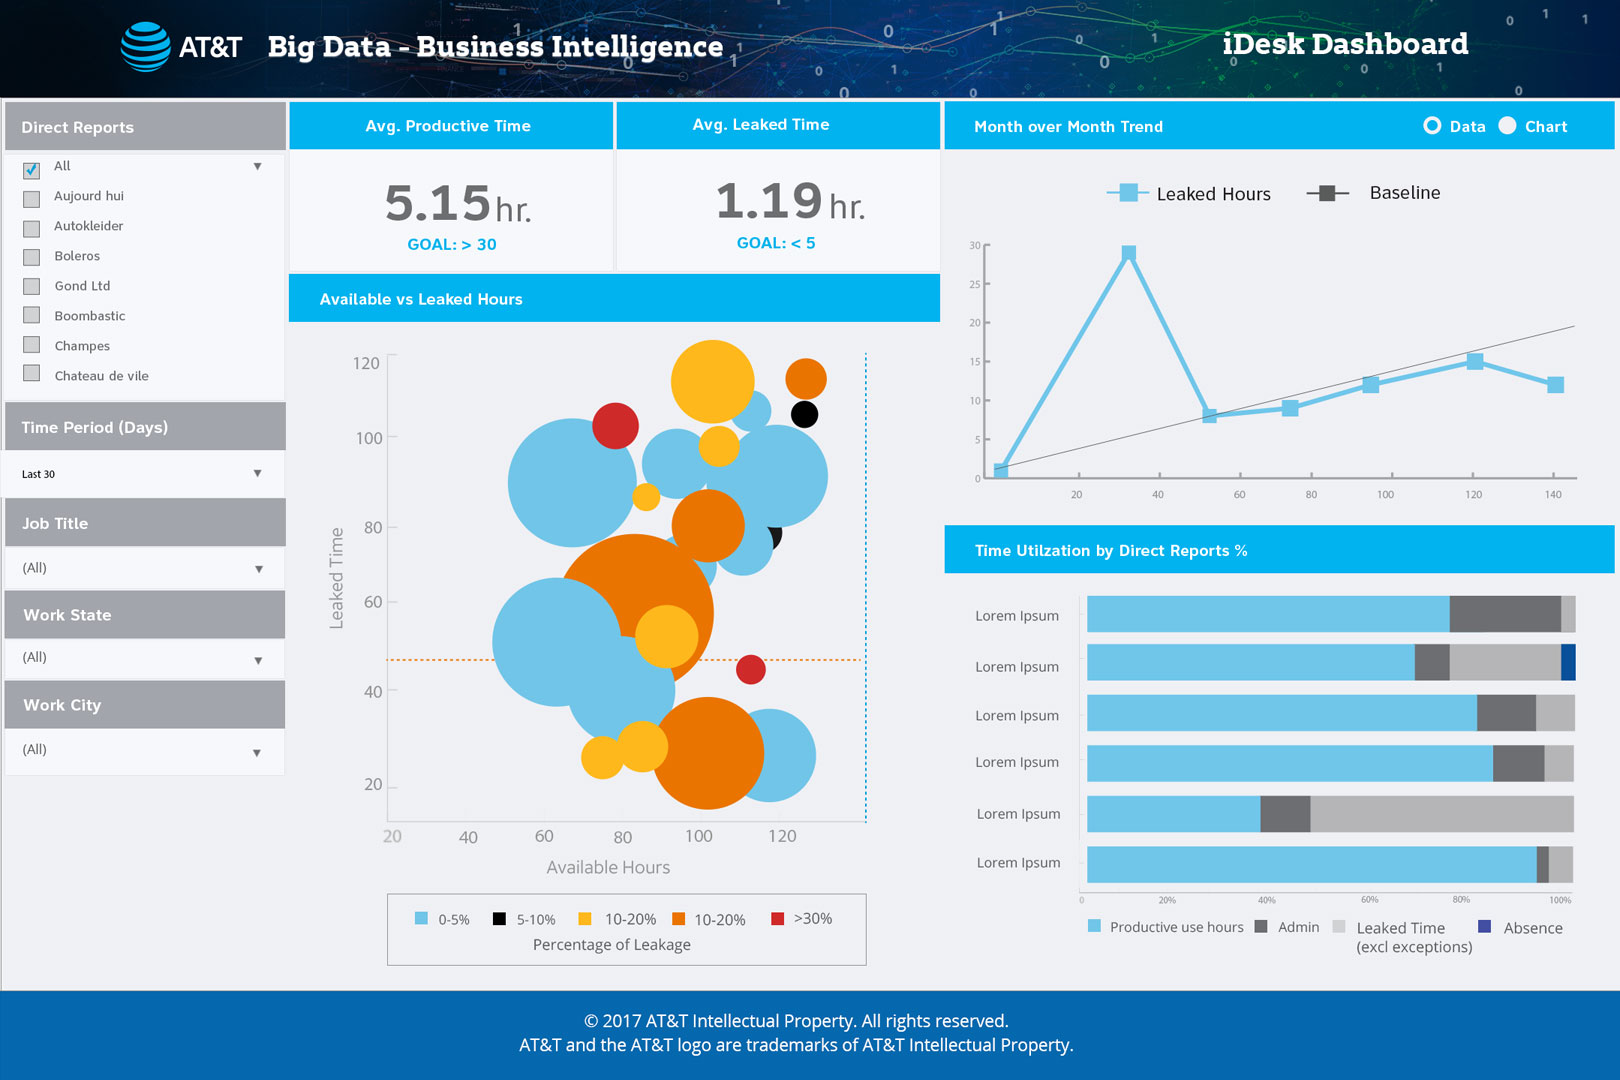
• User-Centered Design: I conducted in-depth user research, including interviews with over 20 internal users, to better understand pain points and the tasks they needed to accomplish with the BI tools. I synthesized these findings into key design priorities, focusing on usability, clarity, and the ability to customize dashboards.

• Prototyping & Testing: I created wireframes and interactive prototypes in Figma, which allowed us to test different UI components and gather user feedback. This iterative process helped us identify the most effective design elements and improve them through A/B testing.


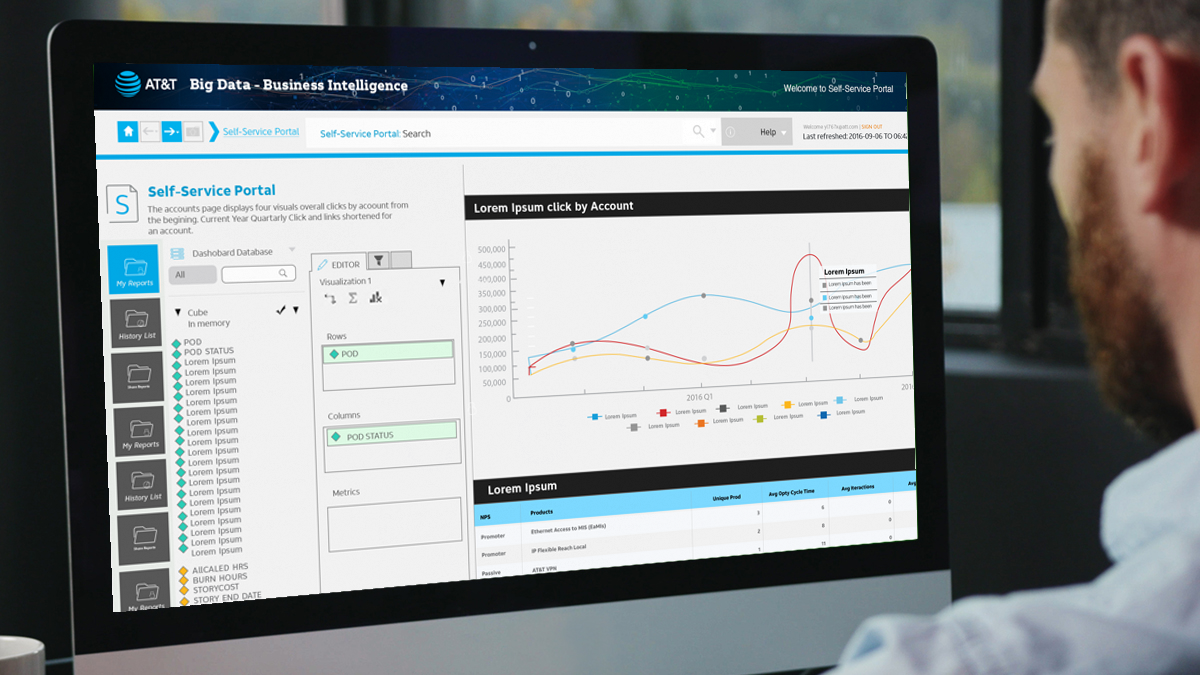
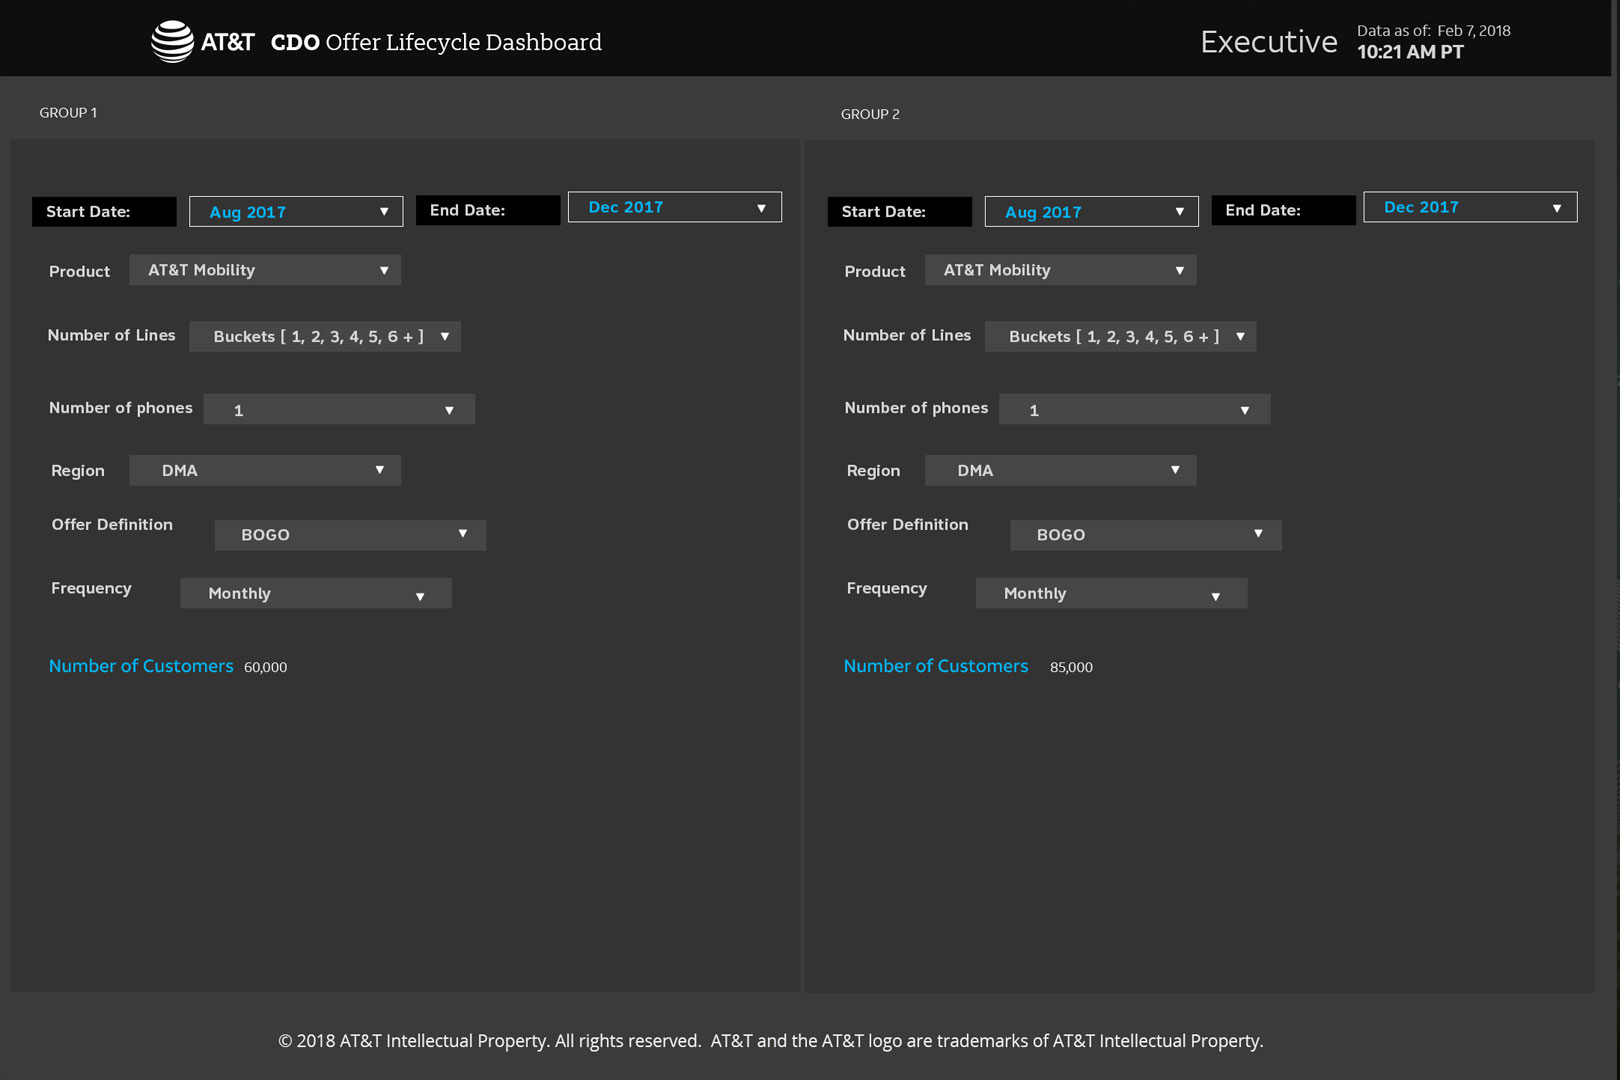
• Customization & Personalization: A core feature of the redesign was the ability for users to personalize their dashboards, allowing them to filter data based on their specific roles. This ensured that different teams (e.g., marketing, finance, operations) could focus on the most relevant metrics and make data-driven decisions more efficiently.

• Collaboration with Engineers: I collaborated closely with the data engineering team to ensure that the new design would not only be user-friendly but also scalable, capable of handling large datasets without compromising performance.


team member

iDesk Dashboard


team member

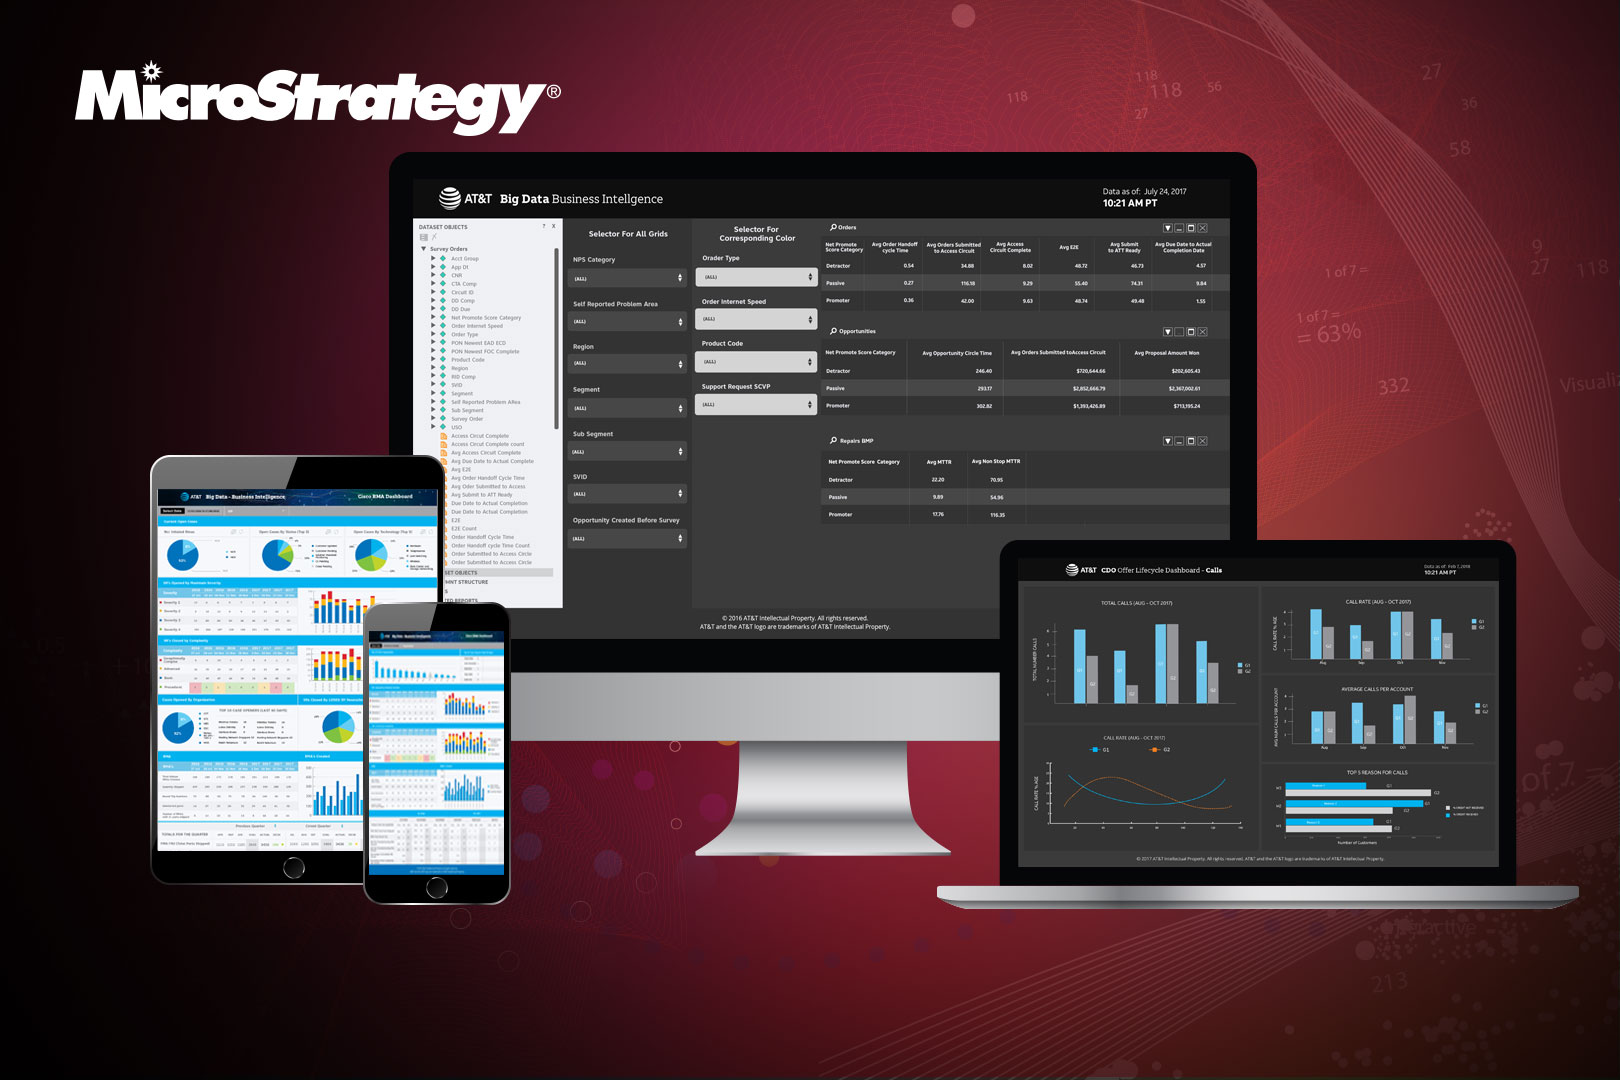
BOGO Lifecycle Dashboard Wireframe


Driving Business Outcomes

• Improved User Engagement: After the redesign, user engagement with the BI dashboard increased by 40%. The intuitive design and personalized dashboards made it easier for users to access relevant insights, significantly boosting adoption across departments.

• Faster Decision-Making: The redesigned dashboard reduced the time users spent navigating through data by 30%, allowing teams to make more timely, data-driven decisions. The ability to view insights at a glance led to faster responses to market trends and operational needs.


• Cost Savings: By improving usability and reducing manual reporting errors, the new design resulted in an estimated $1.5M in annual cost savings. The time saved on manual data processing and reporting was reinvested into more strategic tasks.

• Improved Data Accuracy: The clearer visualizations and improved data validation led to a 12% improvement in data accuracy, enabling teams to spot errors and discrepancies faster, preventing costly mistakes.


team member

Cisco RMA Dashboard

Key Takeaways

• Strategic Alignment: This case study highlights how my design work directly supported DIRECTV’s broader strategy of improving operational efficiency and fostering a more data-driven decision-making culture.

• Cross-Functional Collaboration: It demonstrates my ability to collaborate with diverse teams, aligning design solutions with both user needs and technical feasibility.


• Quantifiable Business Impact:The redesign delivered measurable business outcomes, including increased user engagement, faster decision-making, cost savings, and improved data accuracy.

• User-Centered Design: By focusing on the specific needs of internal users and iterating based on their feedback, the redesign ensured that the BI tools became more useful and accessible to the entire organization.


Works

Works

image
Product, Behind the scene

DIRECTV

Product Enhancements

Case Study
image
Enhanced Decision-Making

AT&T

Business Challenge & Vision

Case Study
image
End of End

Data Quality

Right Information at the Right Time

Case Study
image
AT&T Chief Data Office

AI-Driven Platform

Ask AT&T Platform

Case Study

get in touch

Contact Me

Let"s Jump In!