person

End of End - AT&T"s Data Quality Dashboard Redesign

Role: Head Product Designer
Company: AT&T Chief Data Office
Duration: February 2020 - July 2024
Tools: Power BI, Figma, JIRA, UserTesting
Team: Product Managers, Data Engineers, UX/UI Designers, QA Analysts (12 people total)

Project Overview

AT&T"s Data Quality Dashboard is a critical tool for internal teams such as data analysts and managers. However, declining user engagement, unclear data visualizations, and a lack of customization created friction, hindering data-driven decision-making. As the Head Product Designer, I led a comprehensive redesign to improve usability, enhance decision-making, and foster cross-functional collaboration across AT&T’s teams.


team member

Strategic Leadership Highlights

Business Challenge & Vision

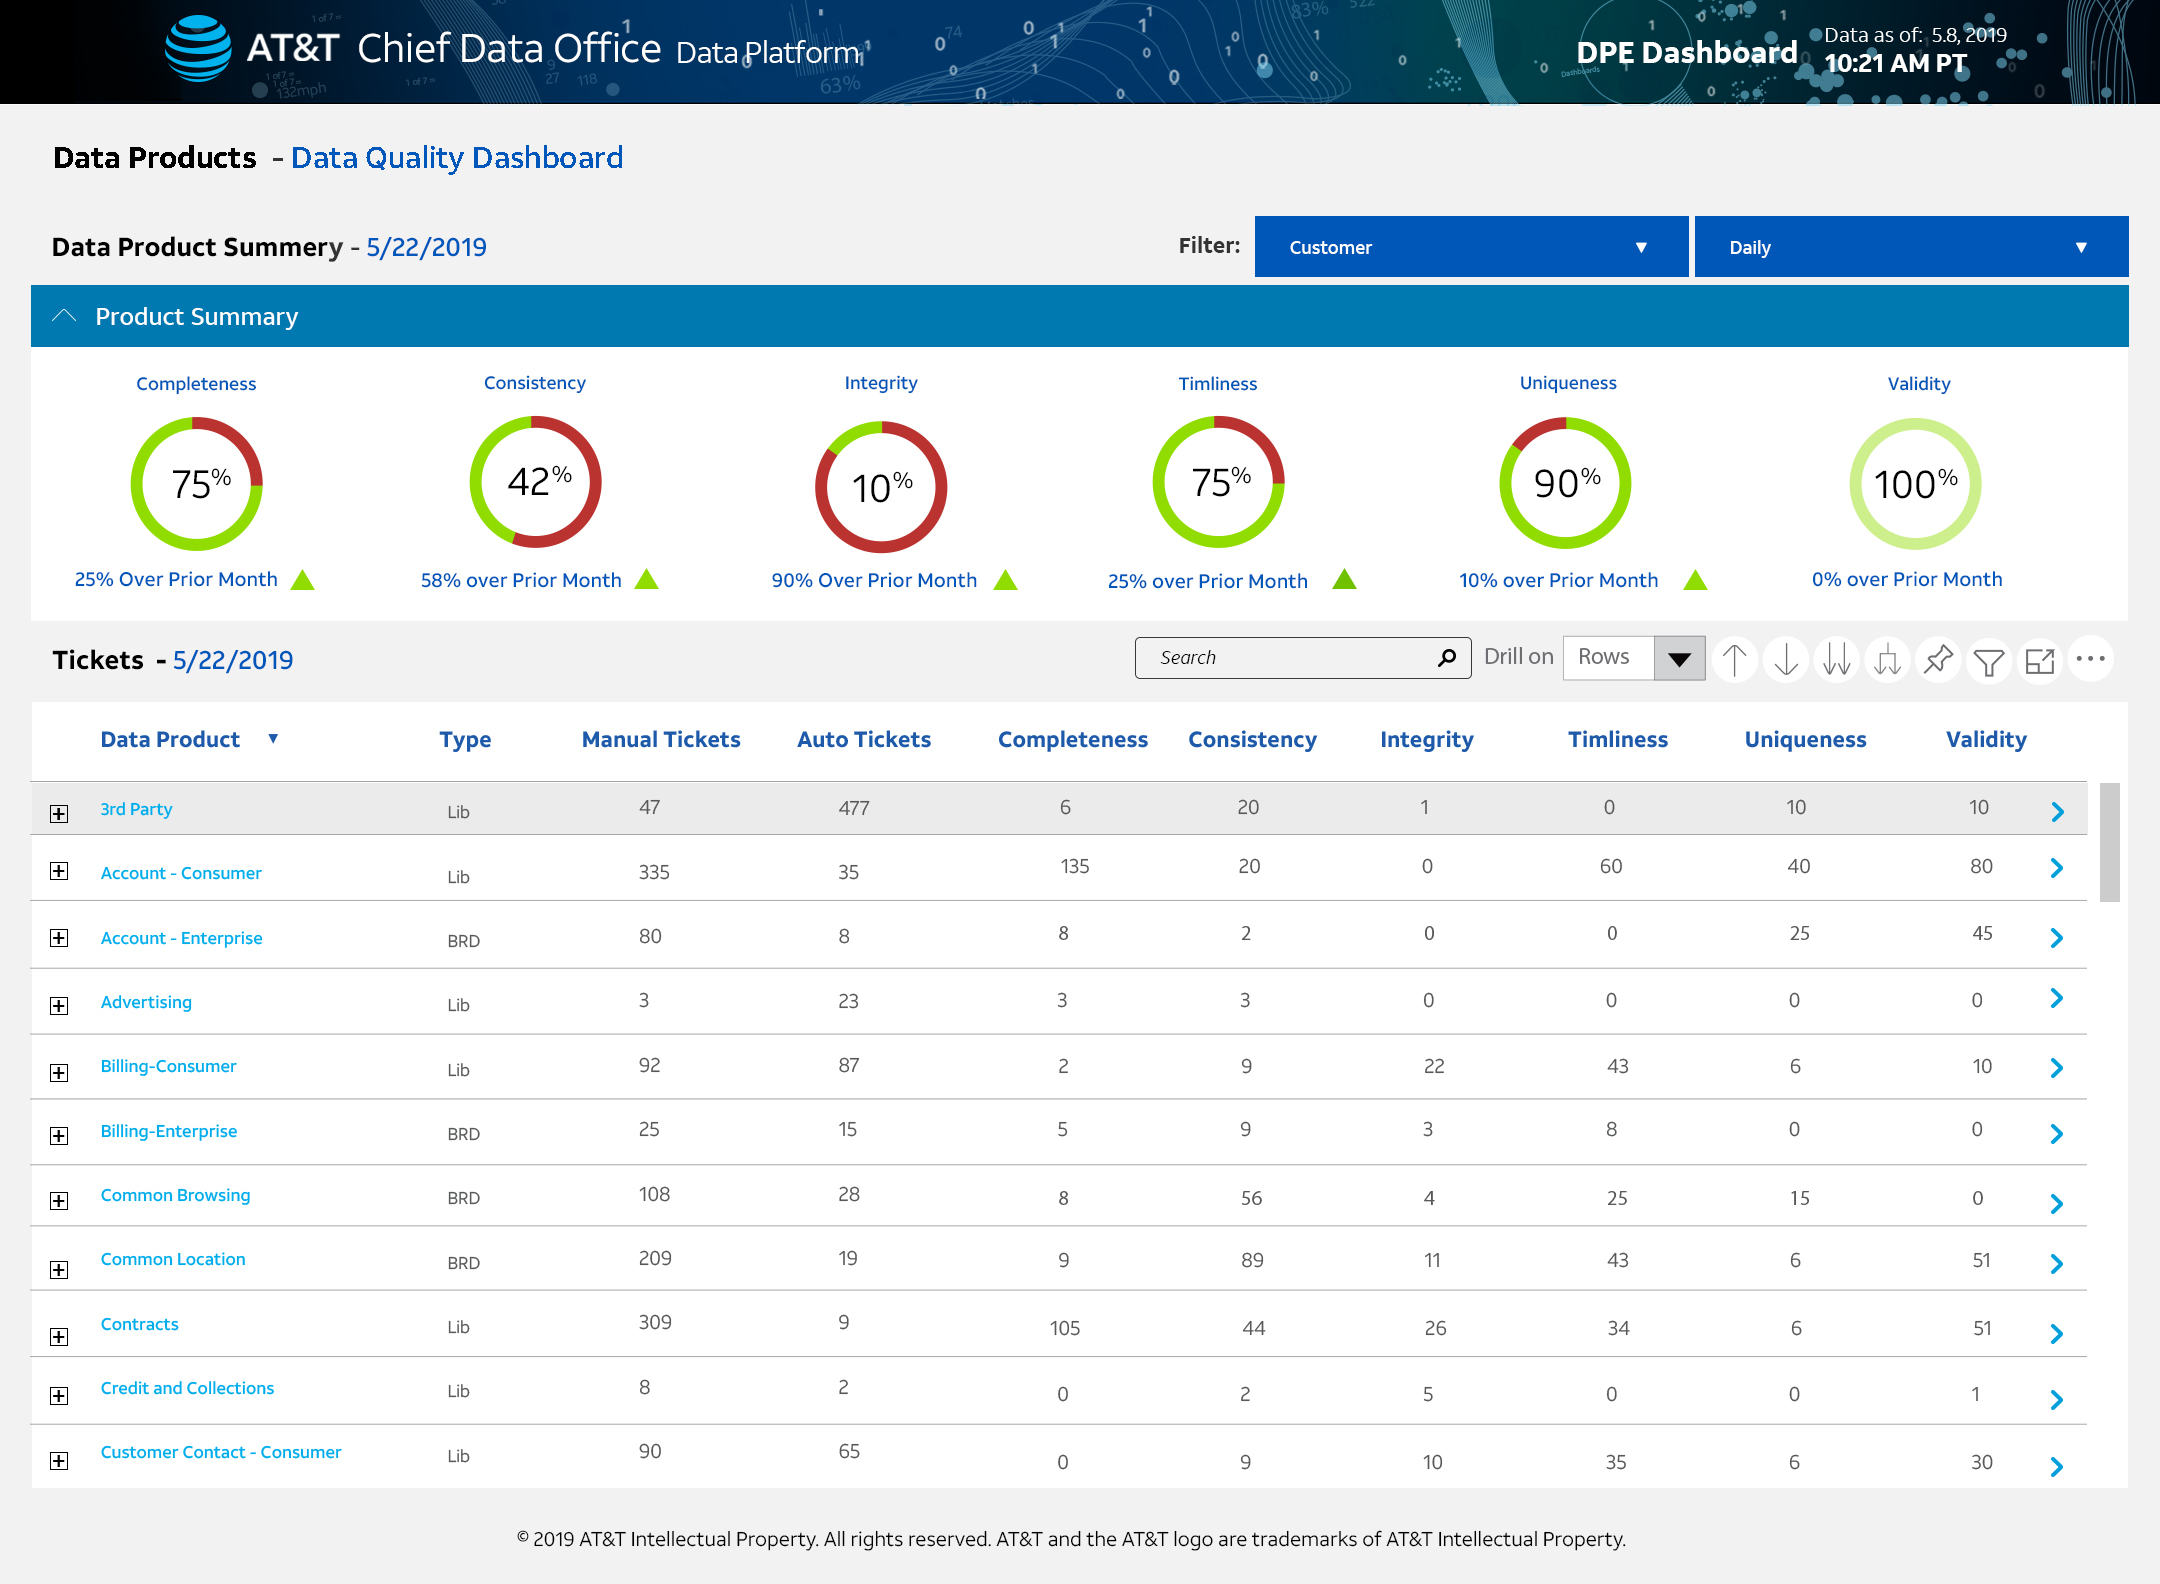
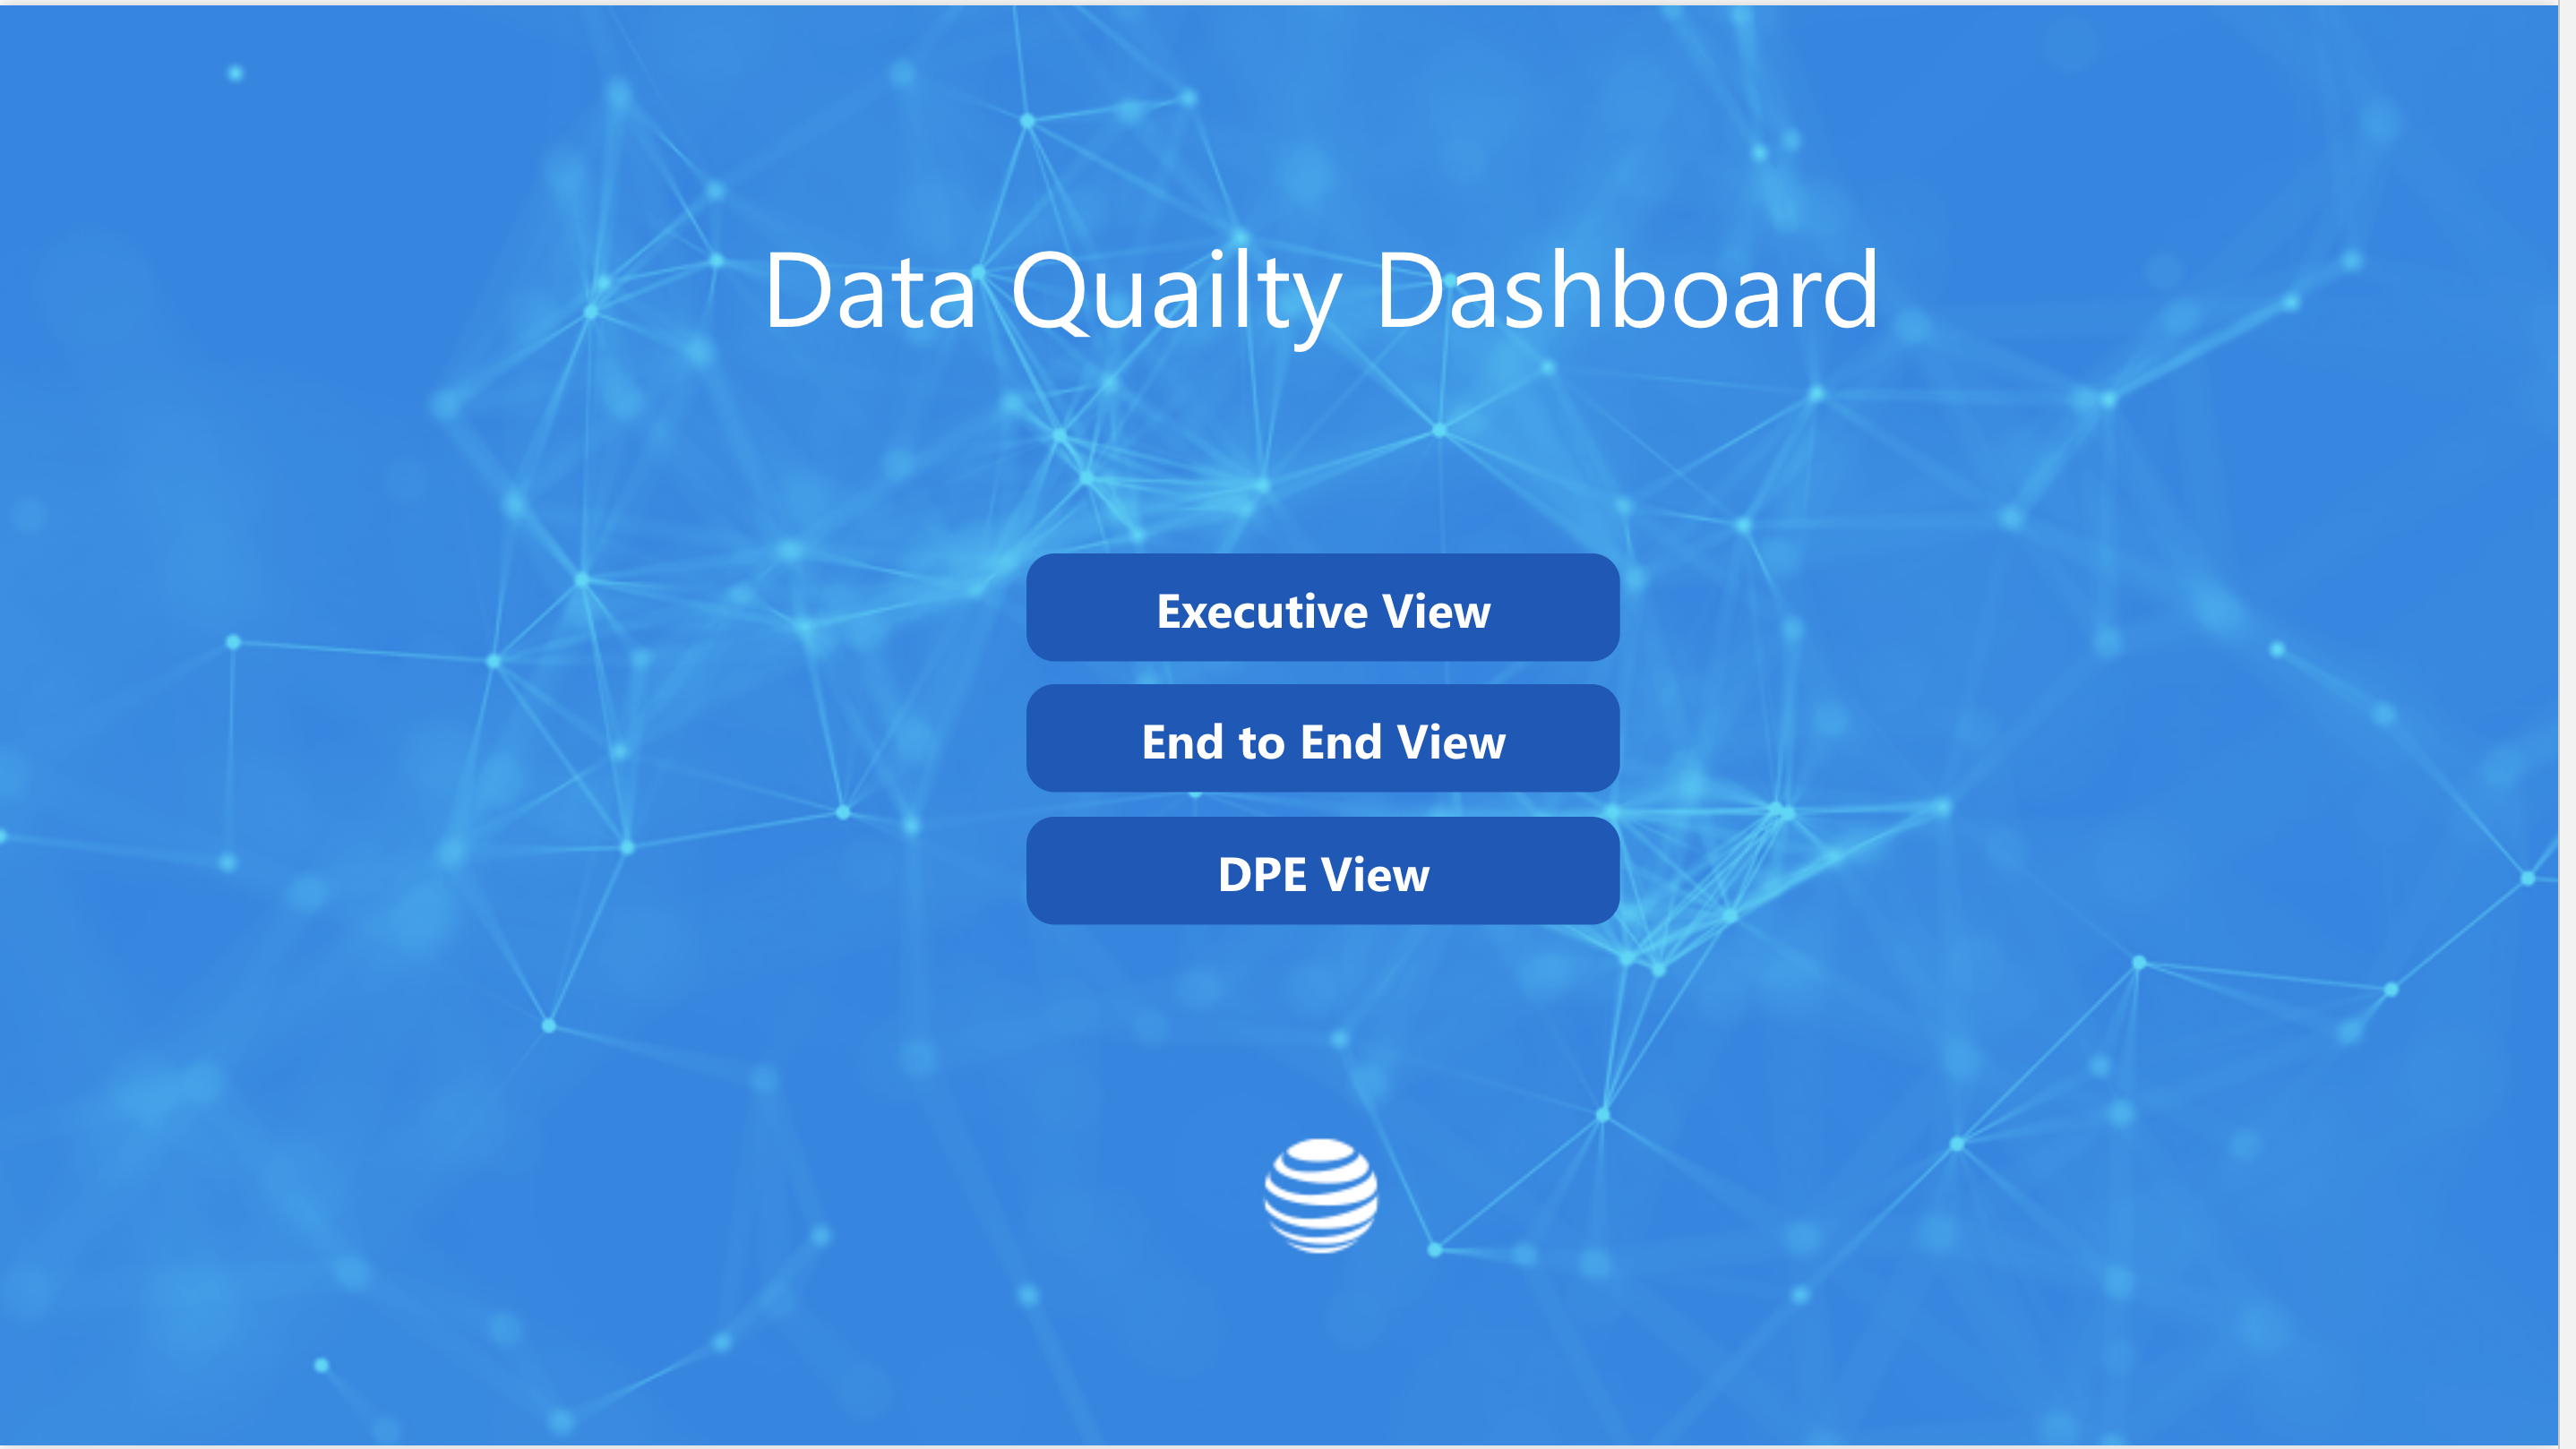
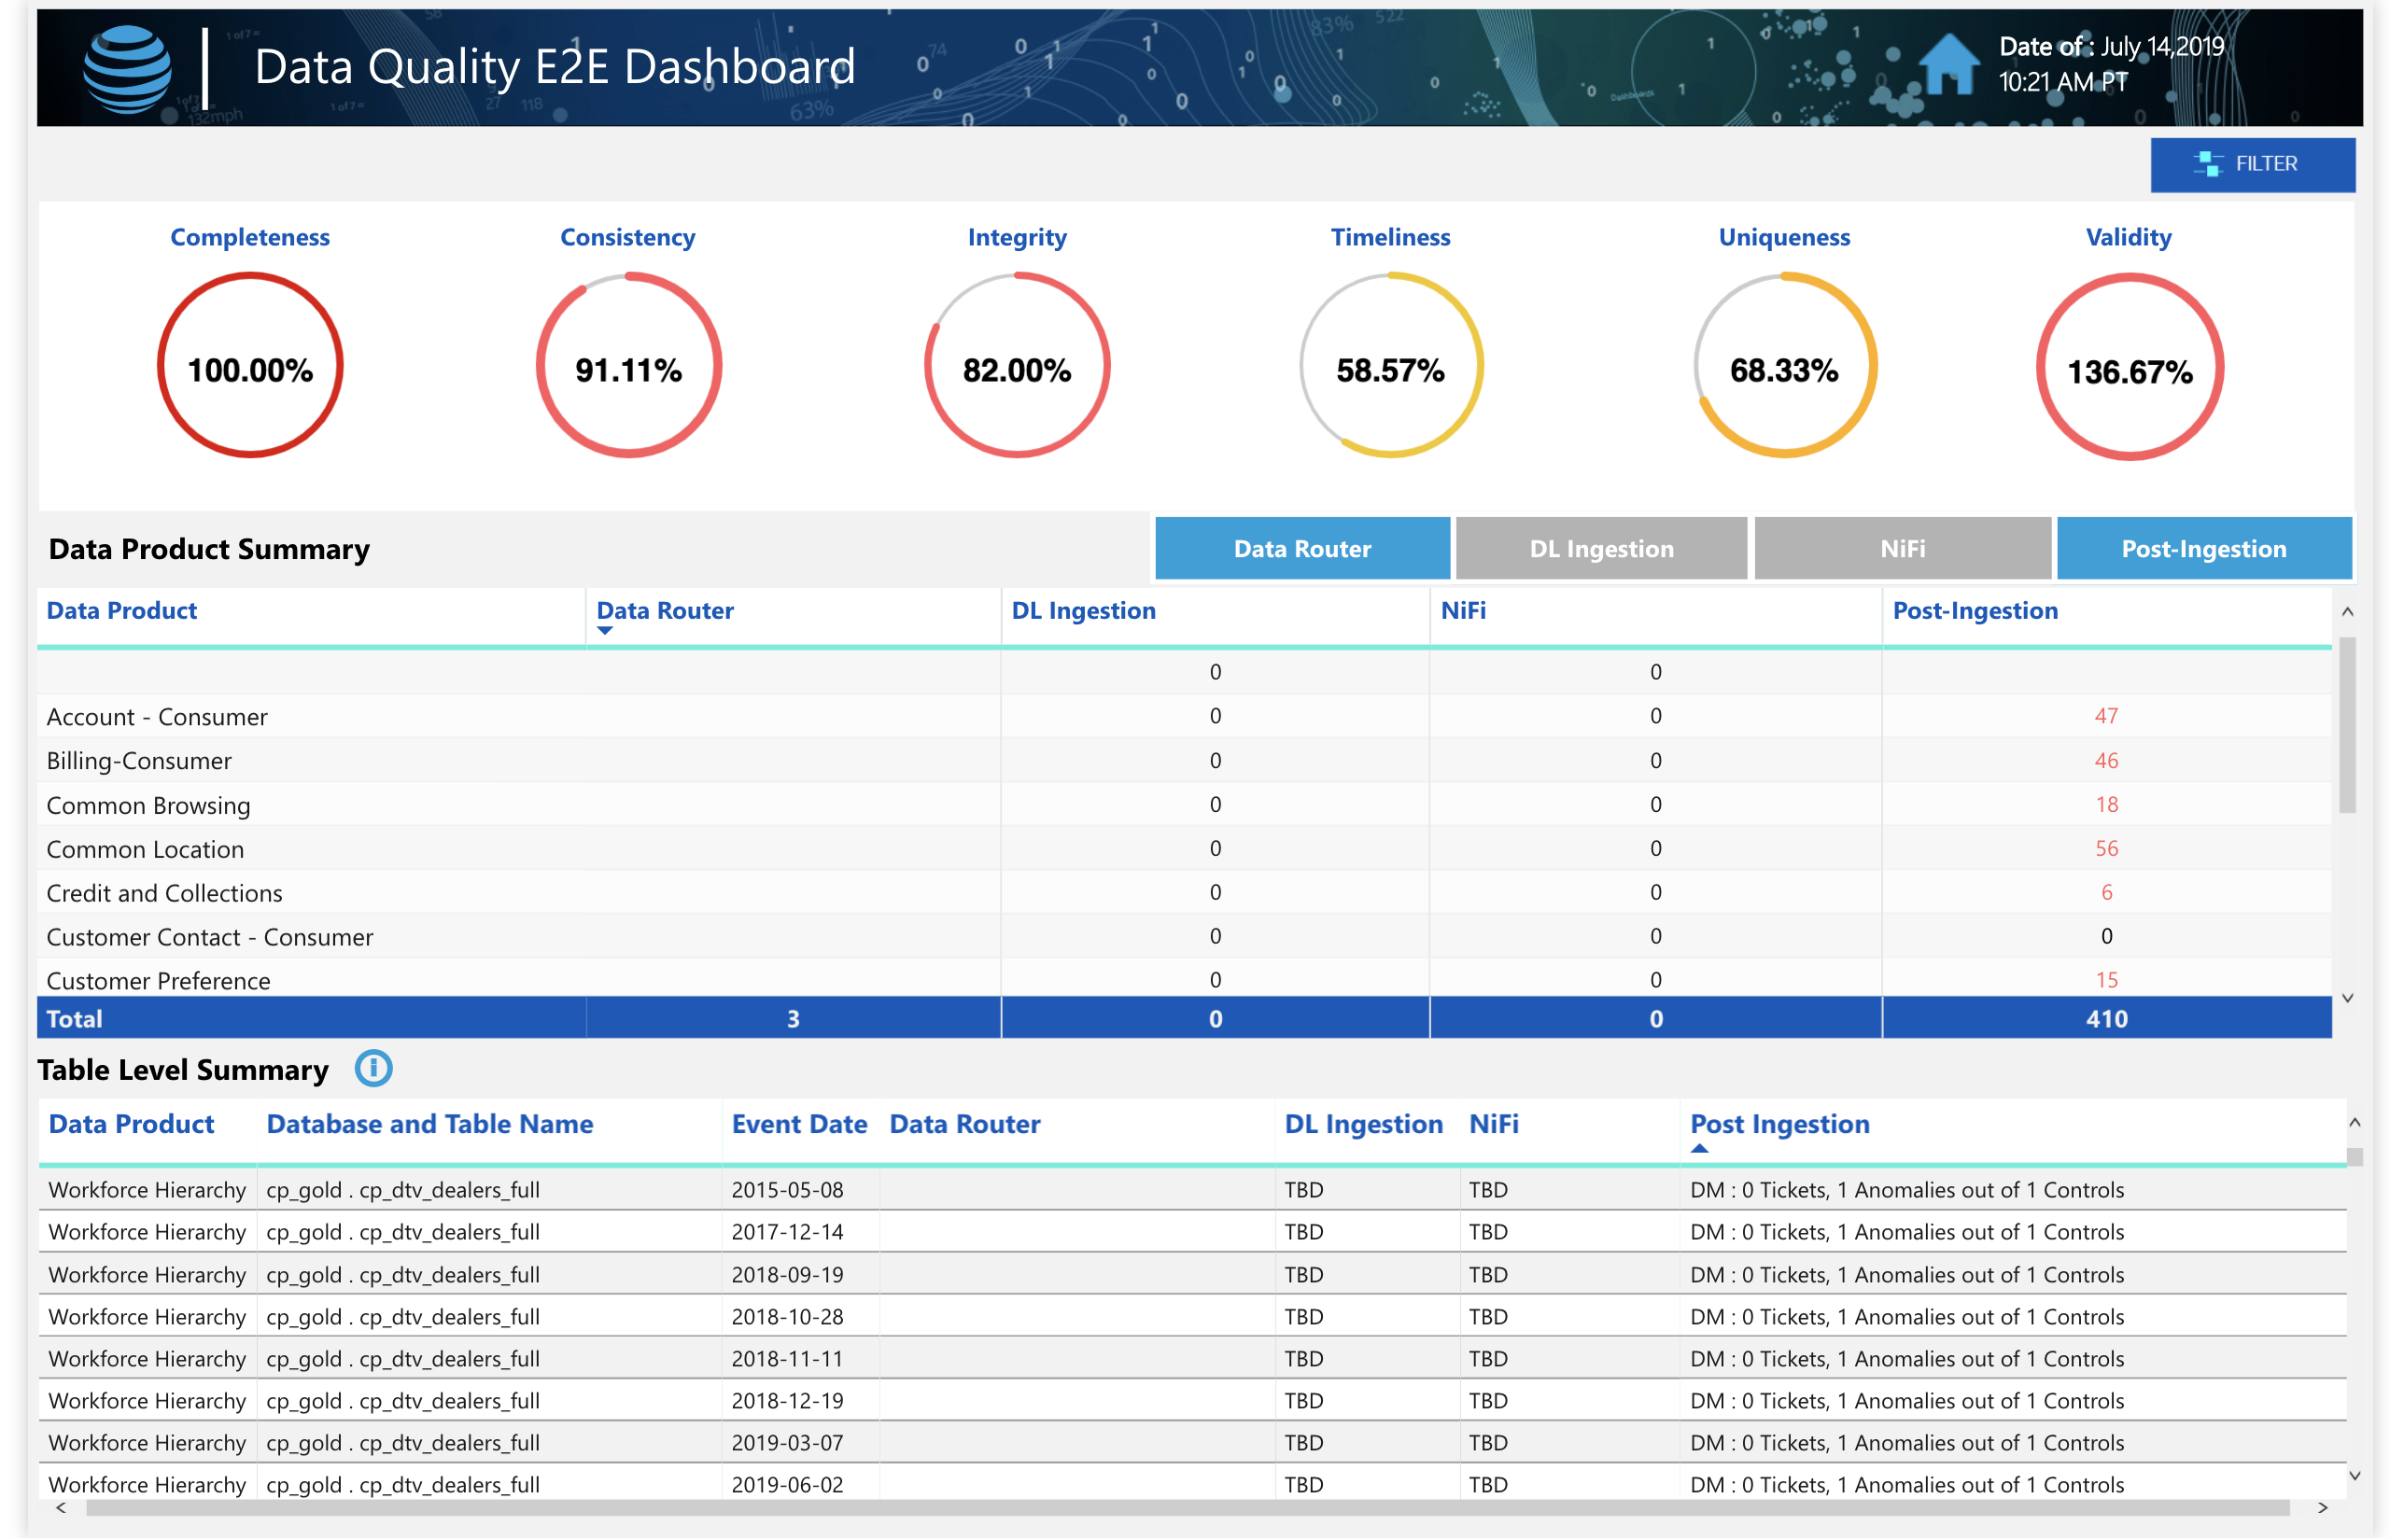
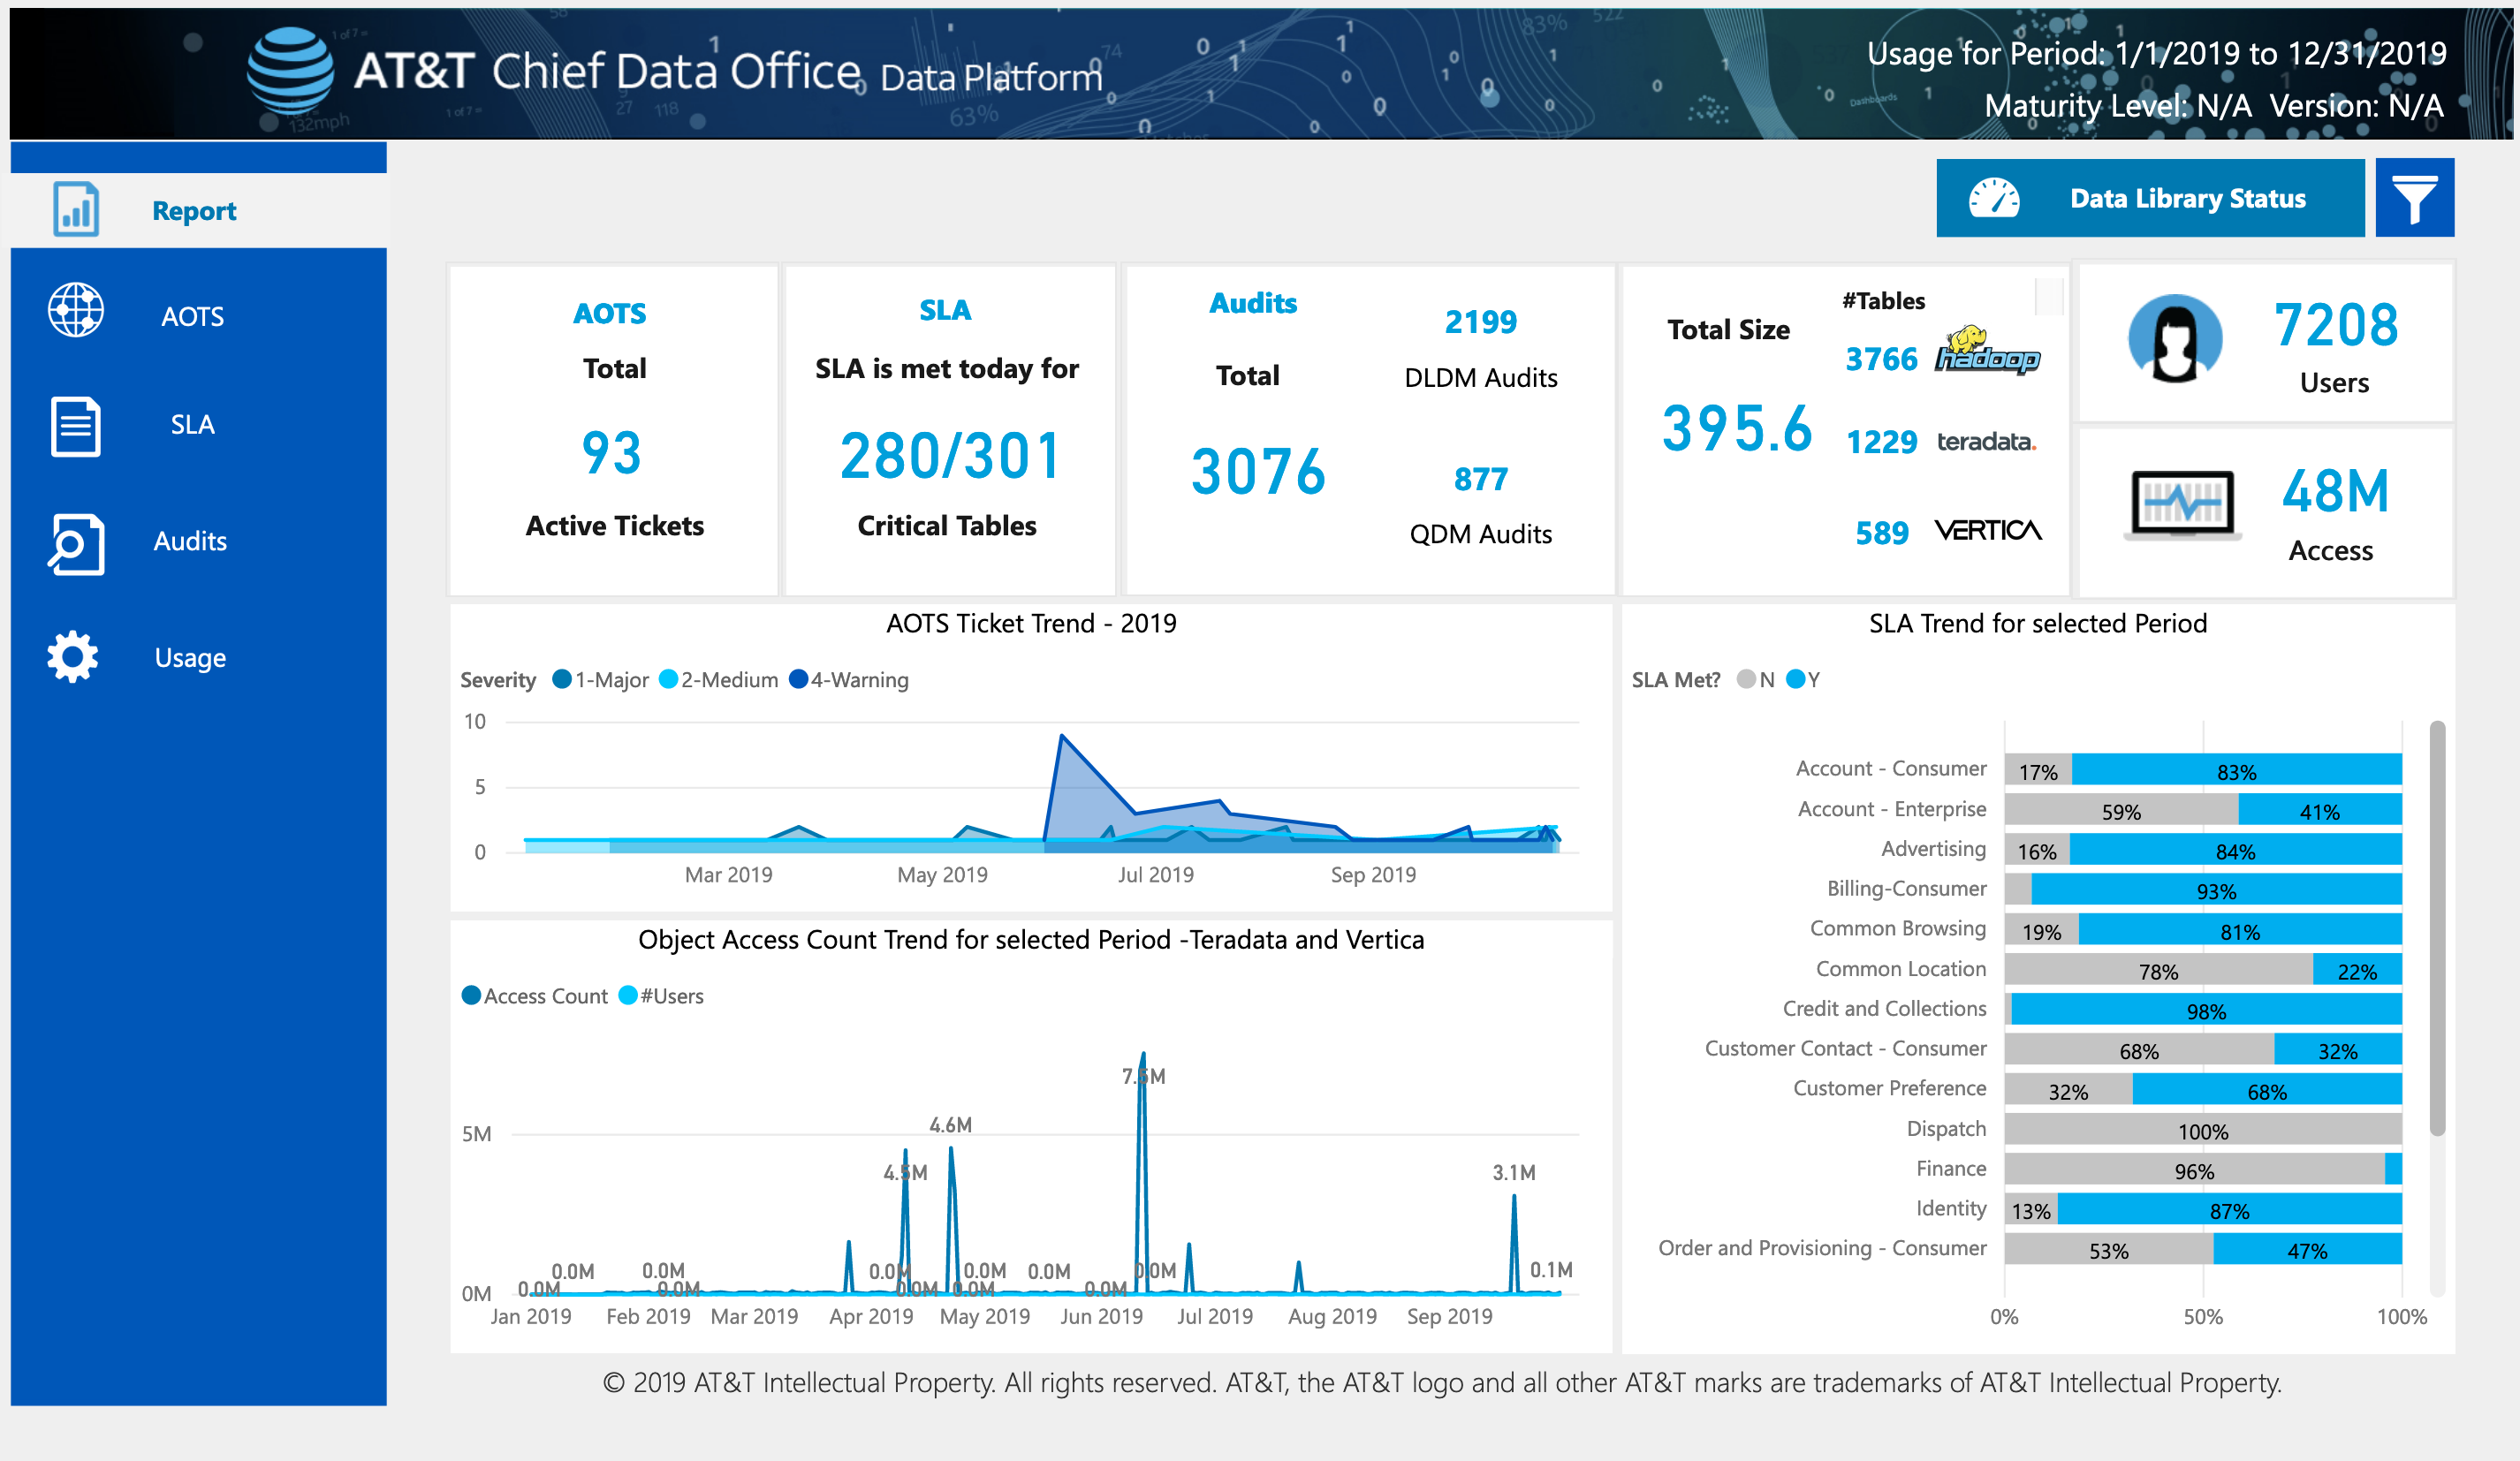
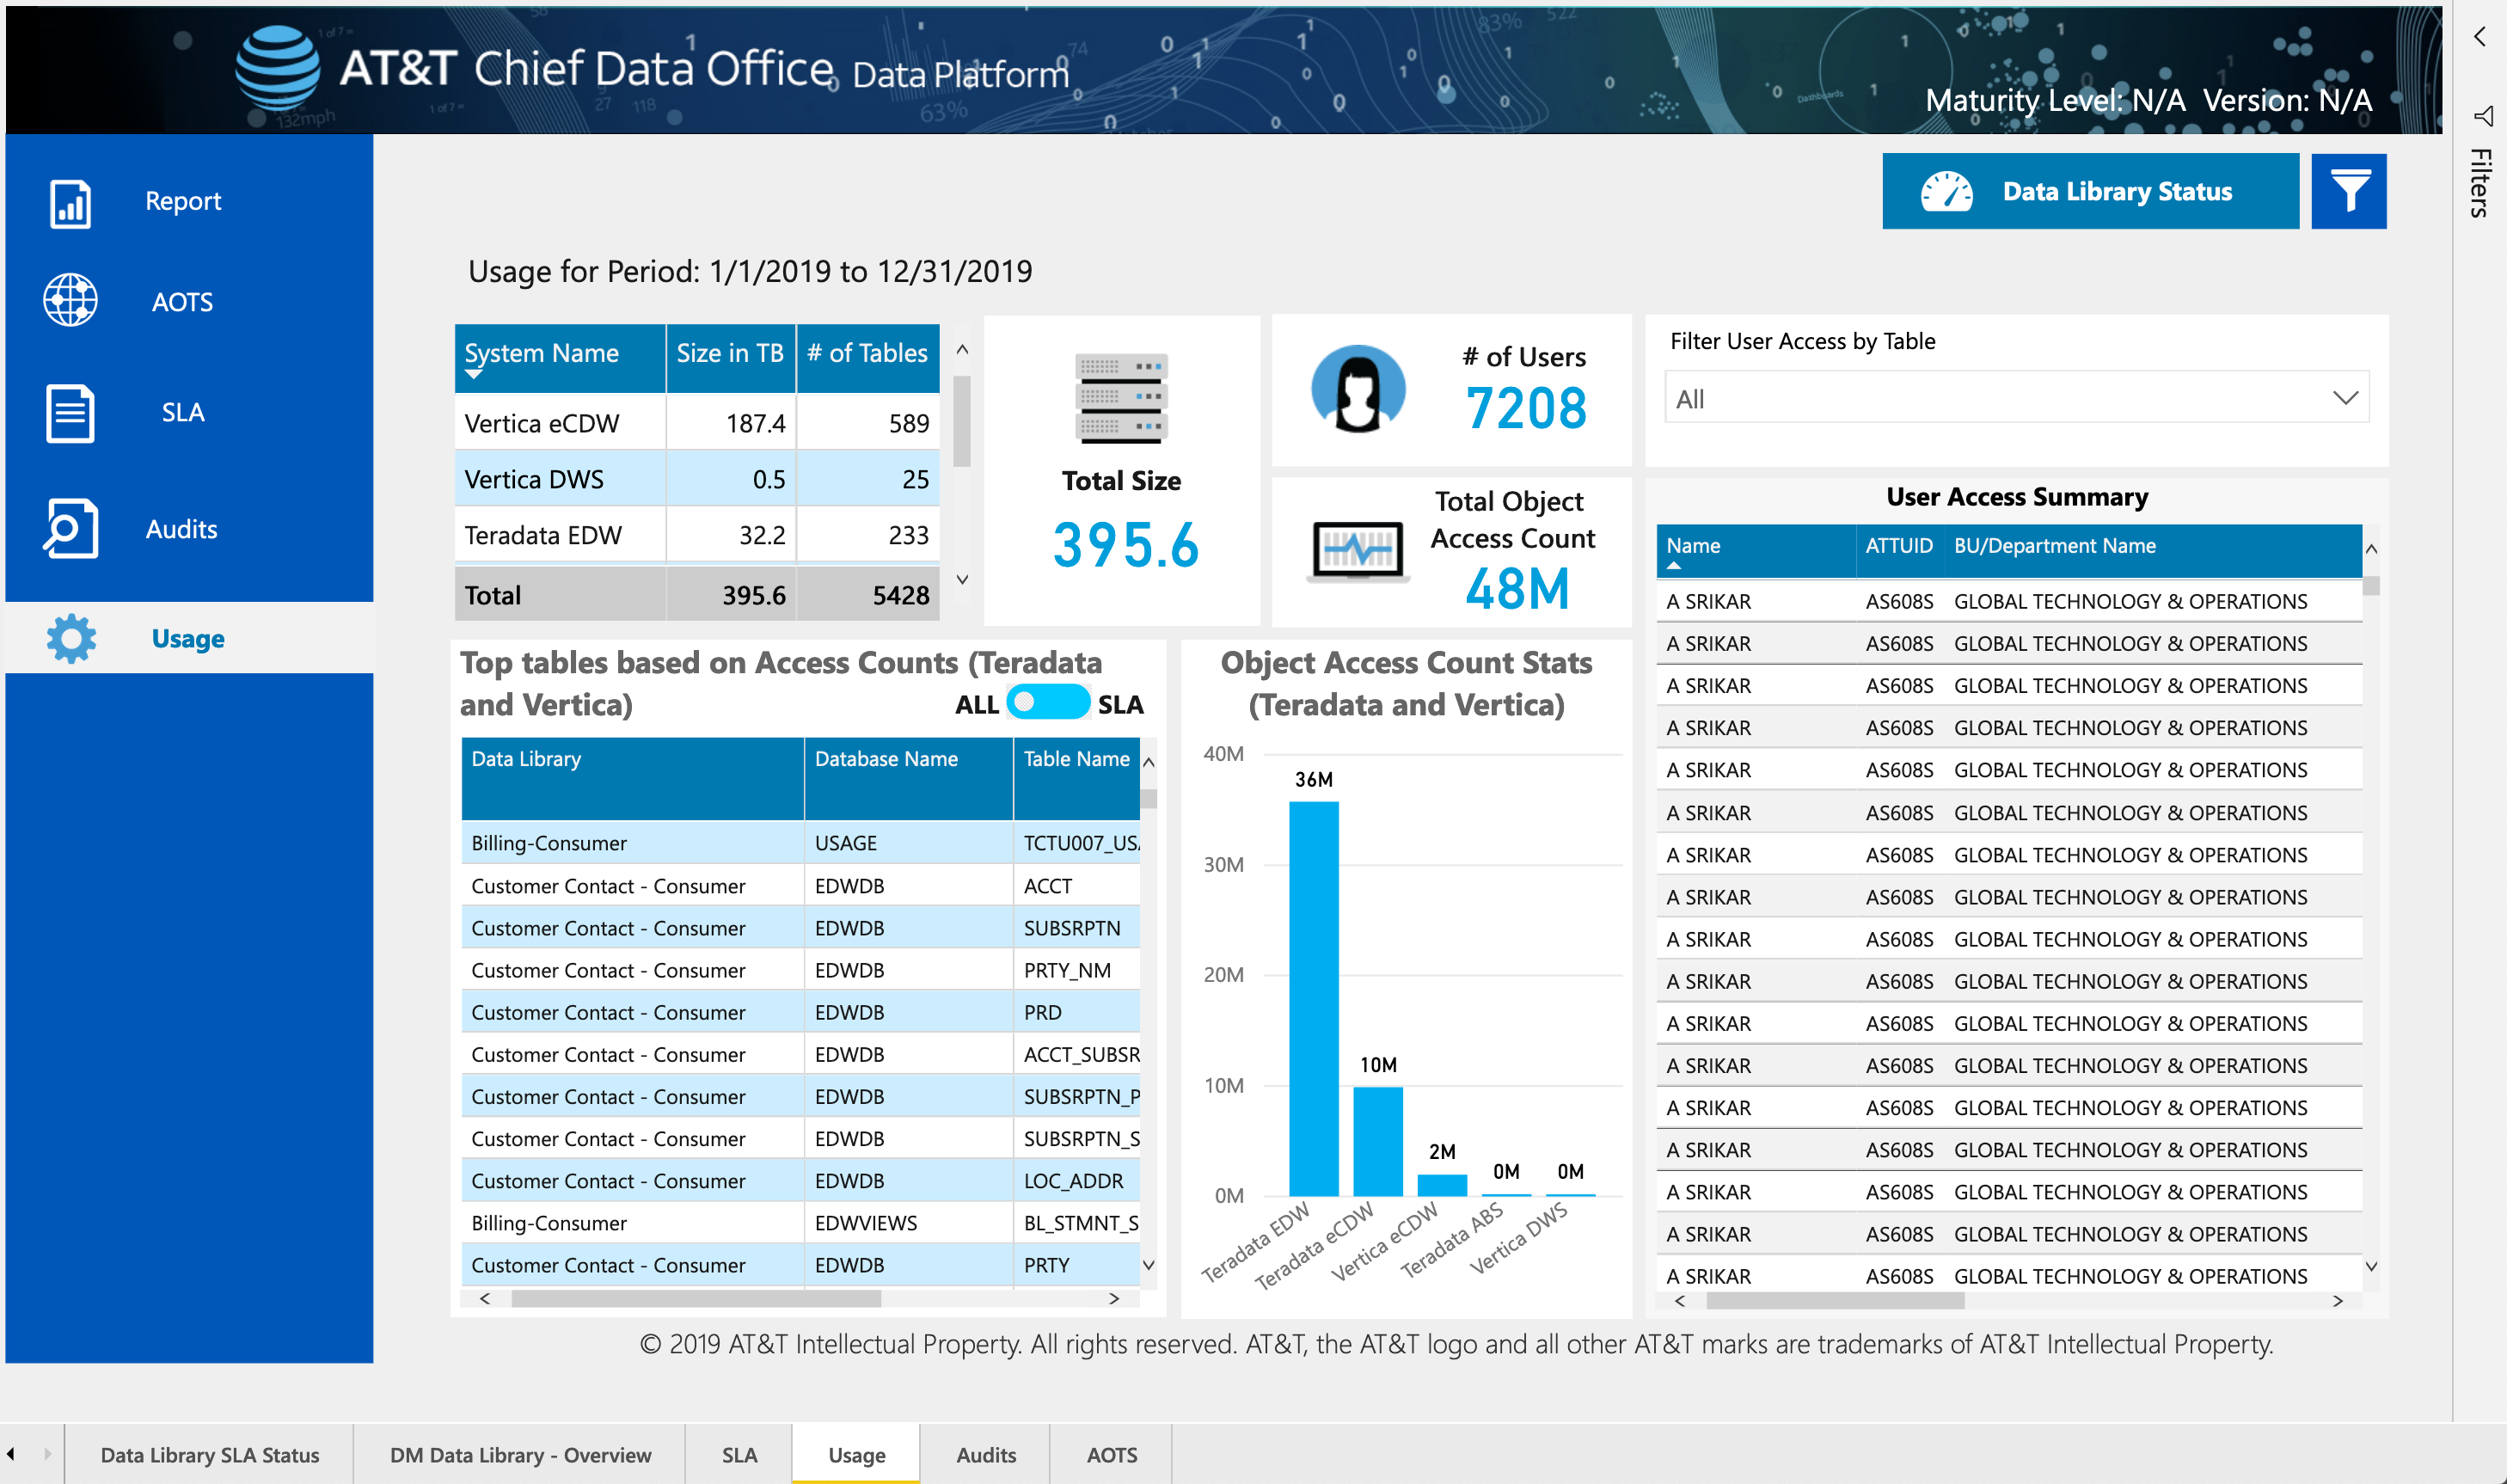
The core challenge was to create a dashboard that delivered the right information at the right time. Existing issues included 

• Complex Navigation: Users faced unnecessary hurdles in accessing critical insights.

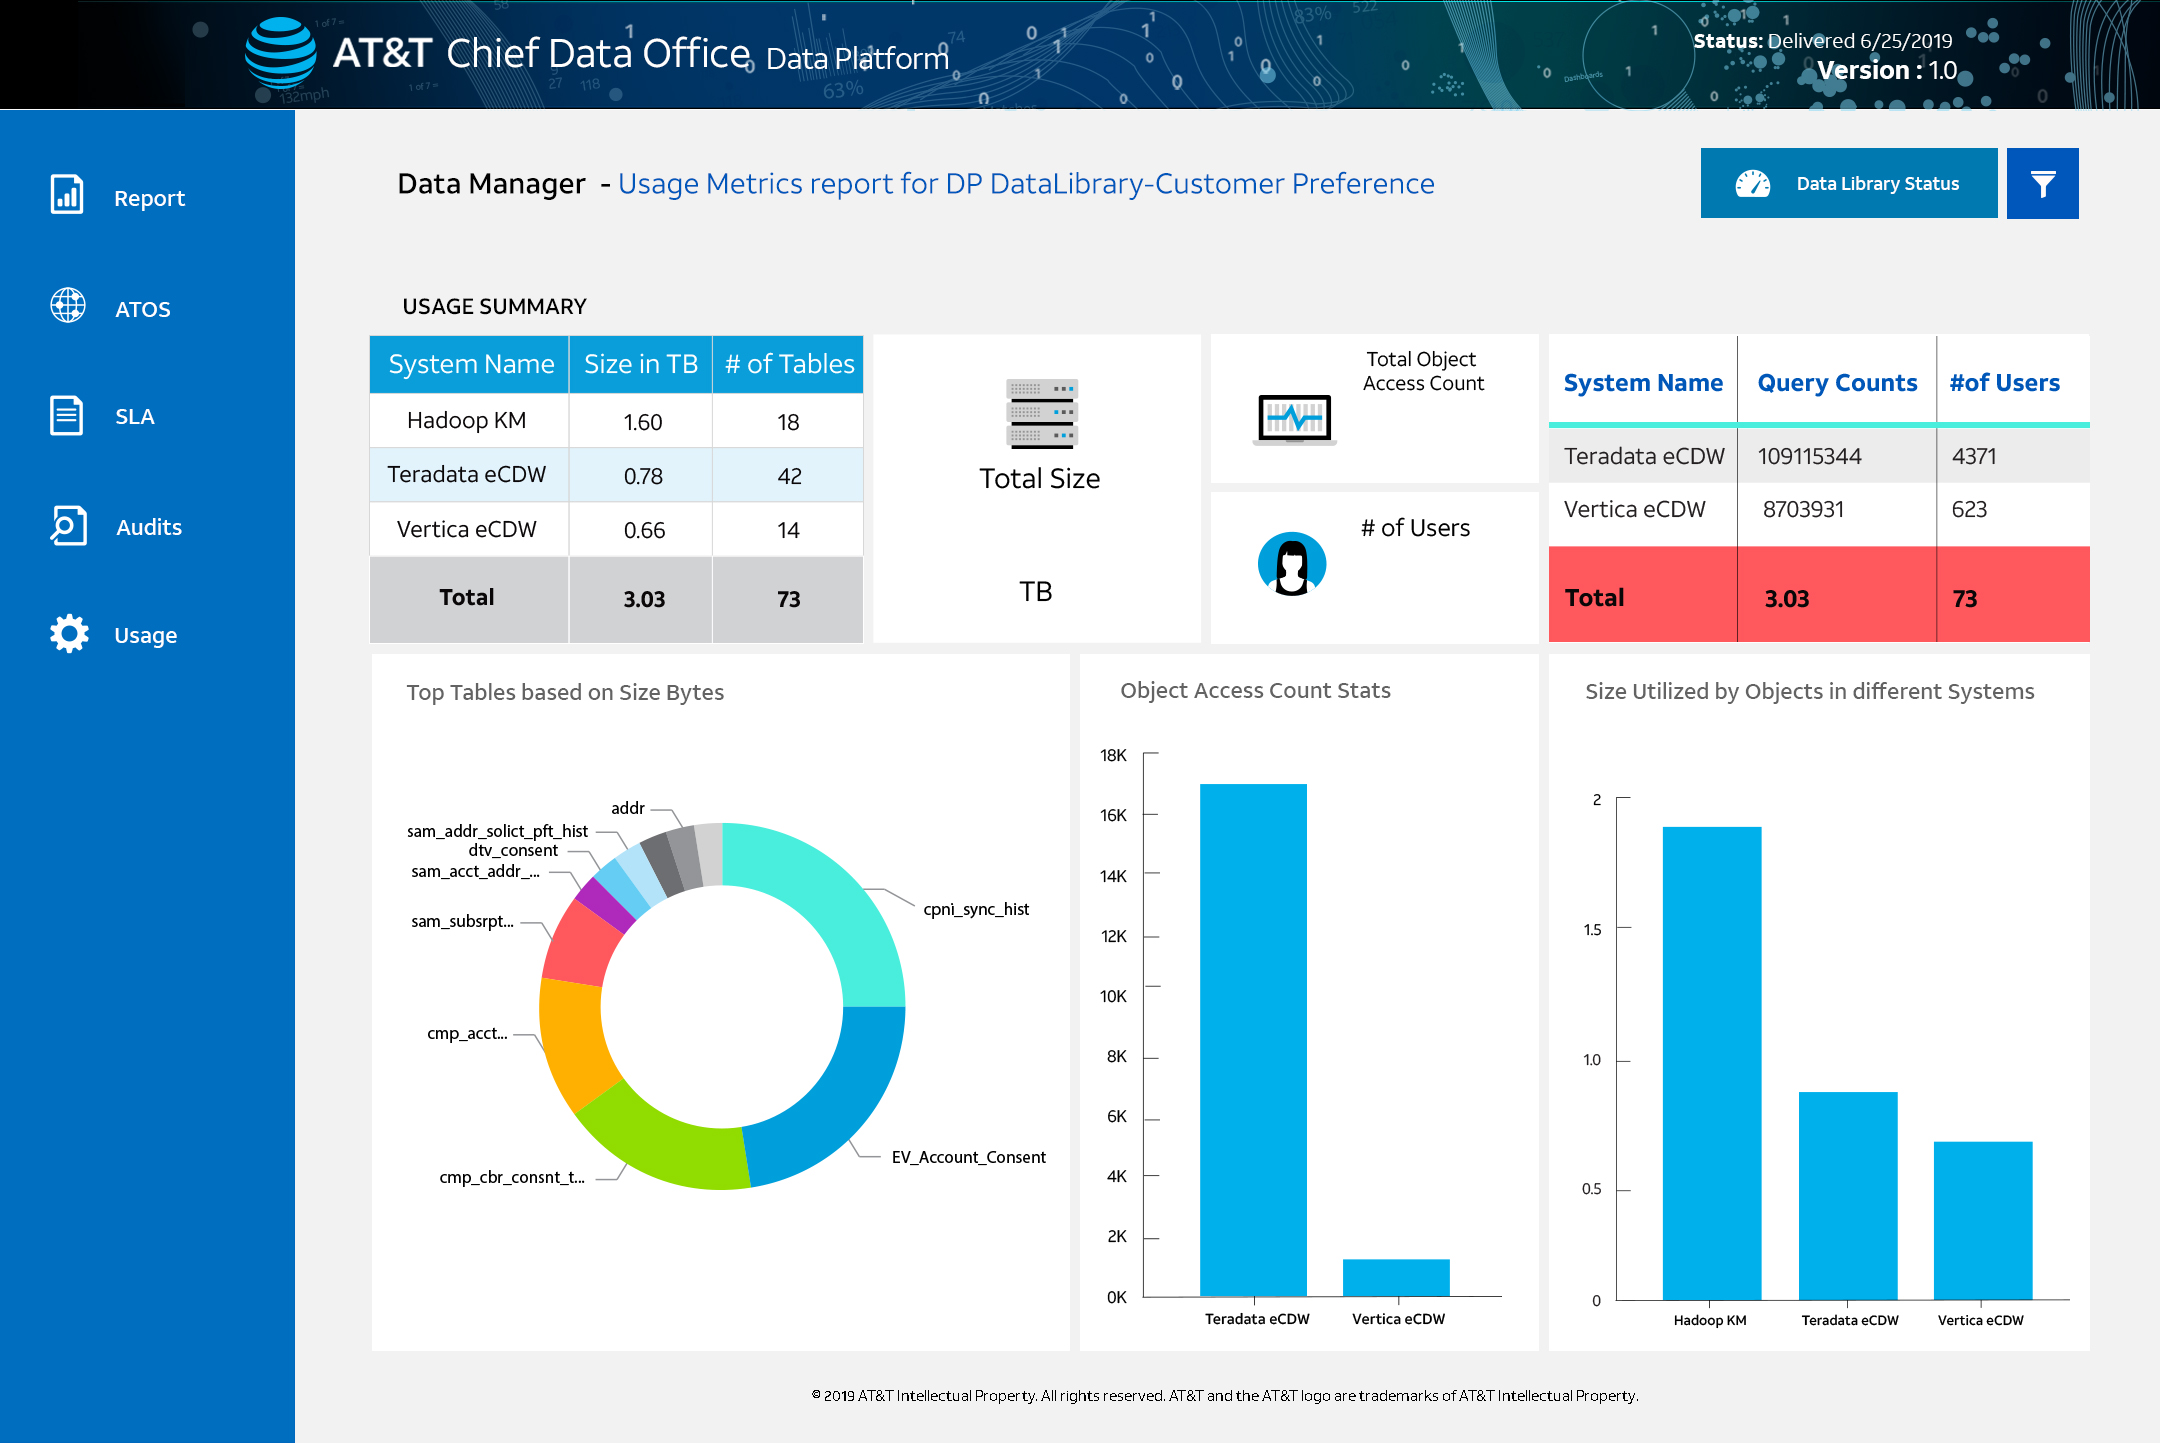
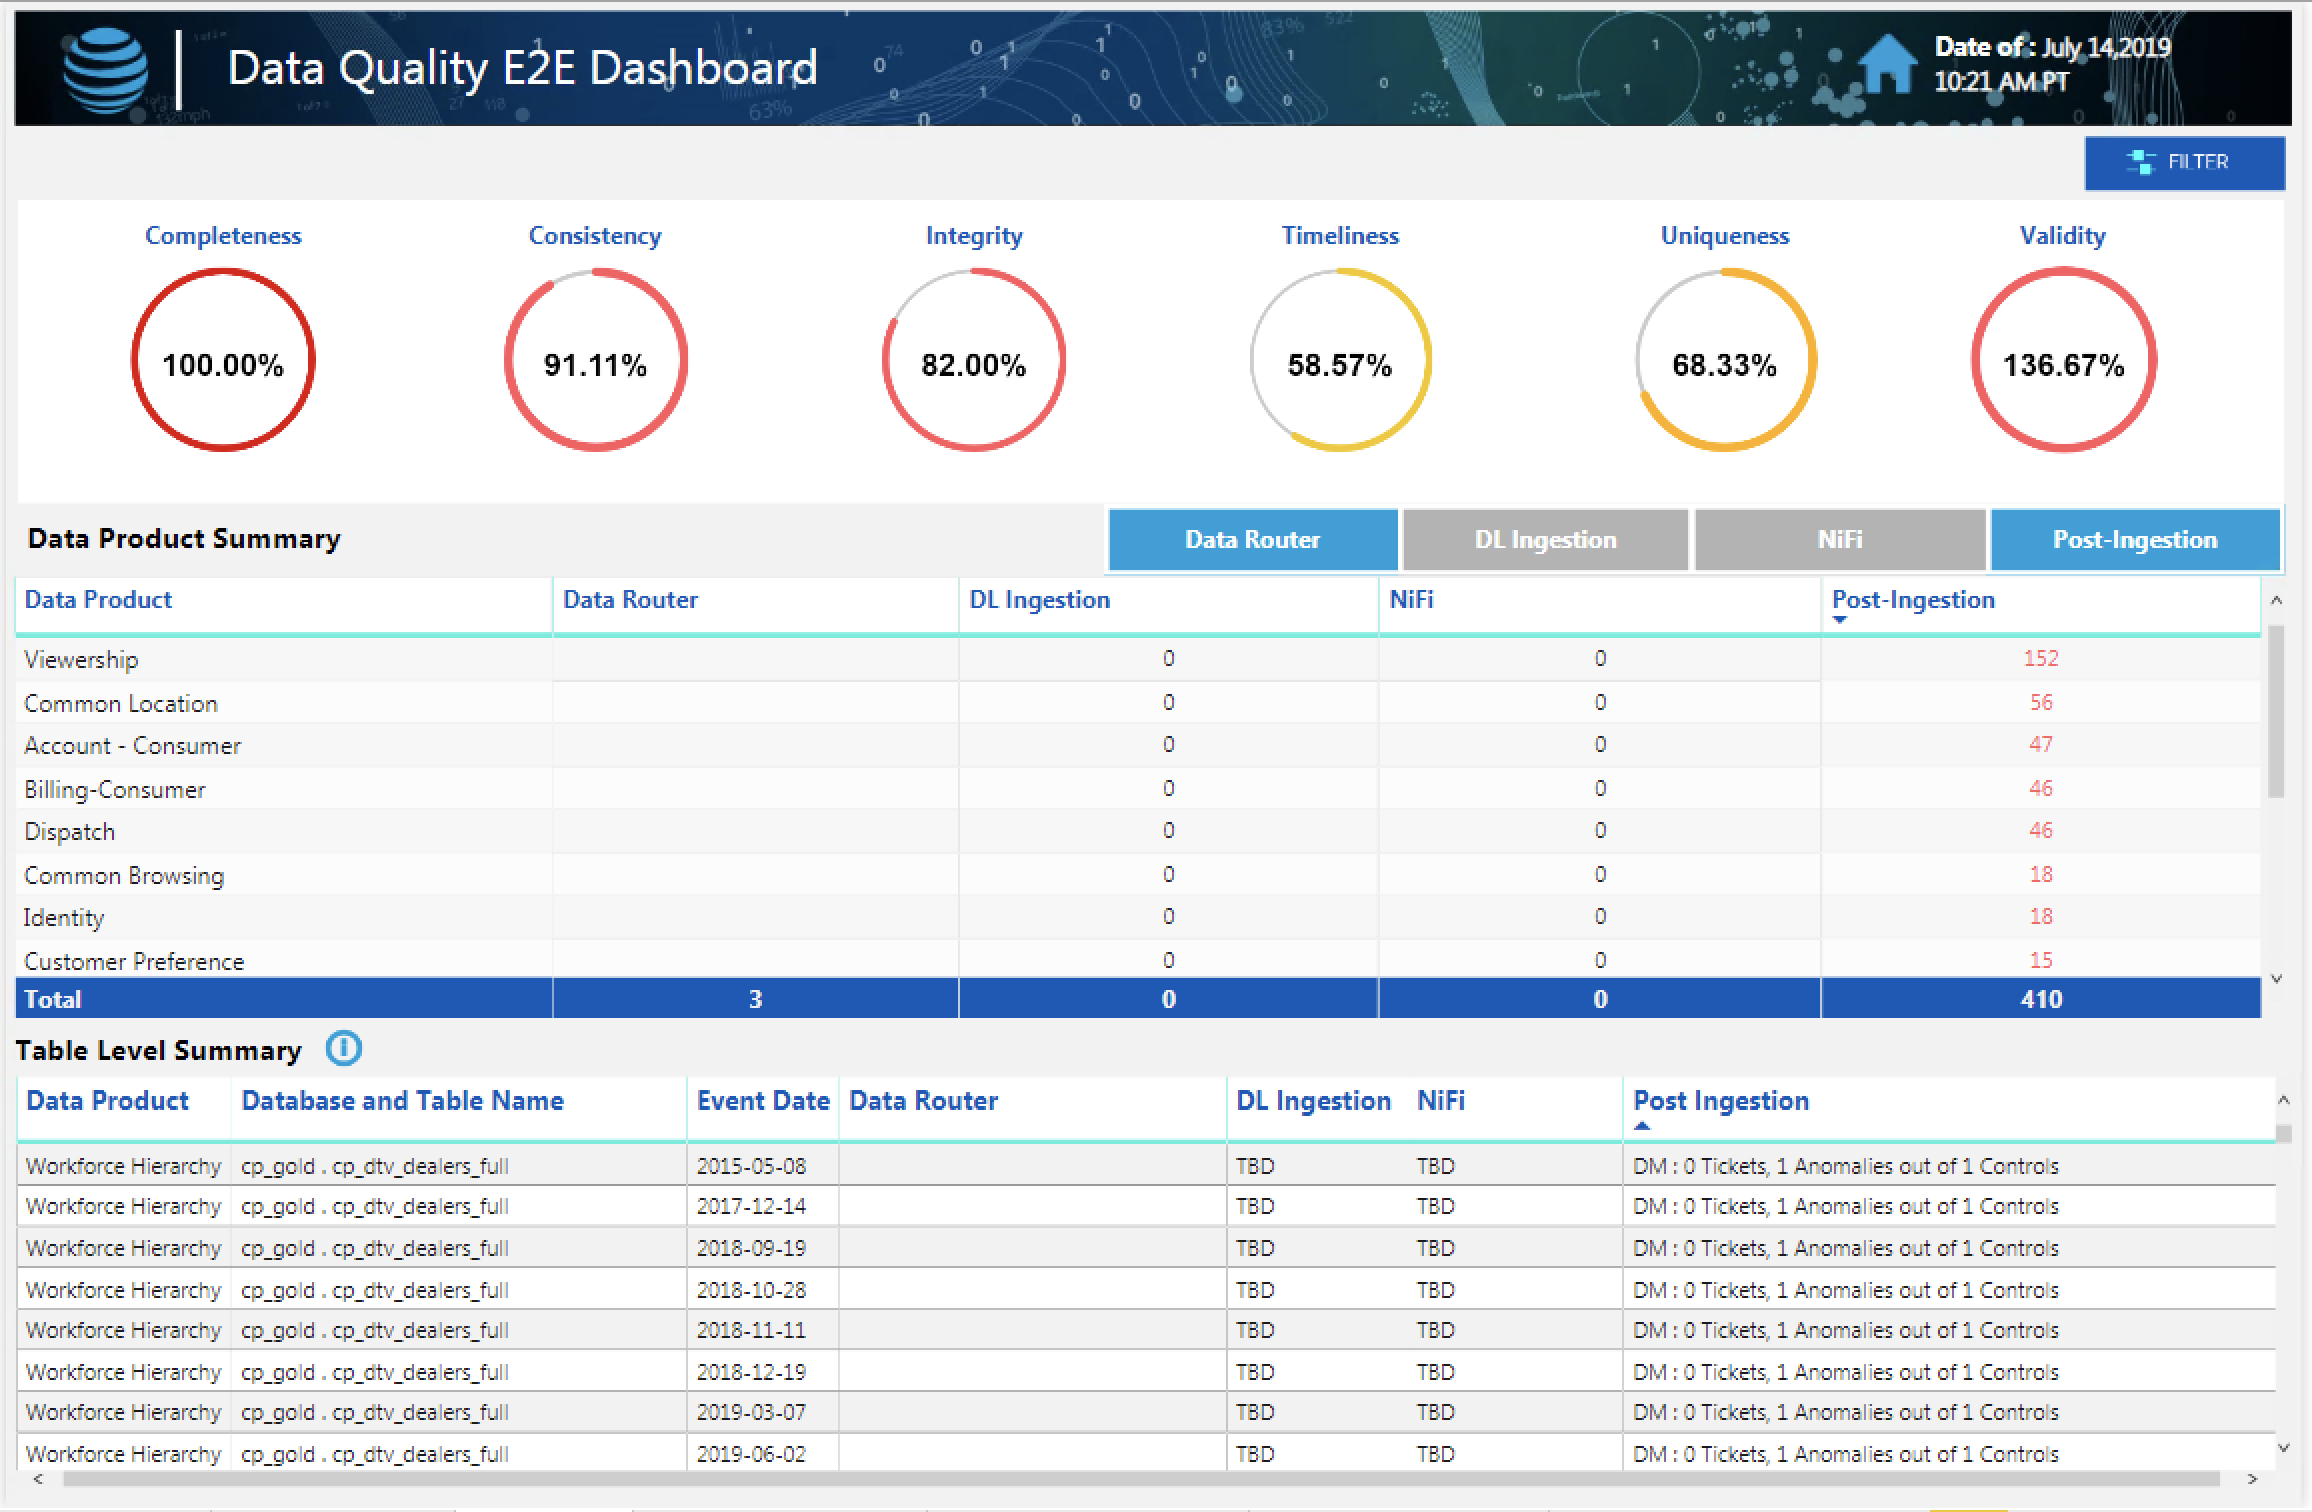
• Unclear Visualizations: Data presentation was inconsistent, leading to inefficiencies.

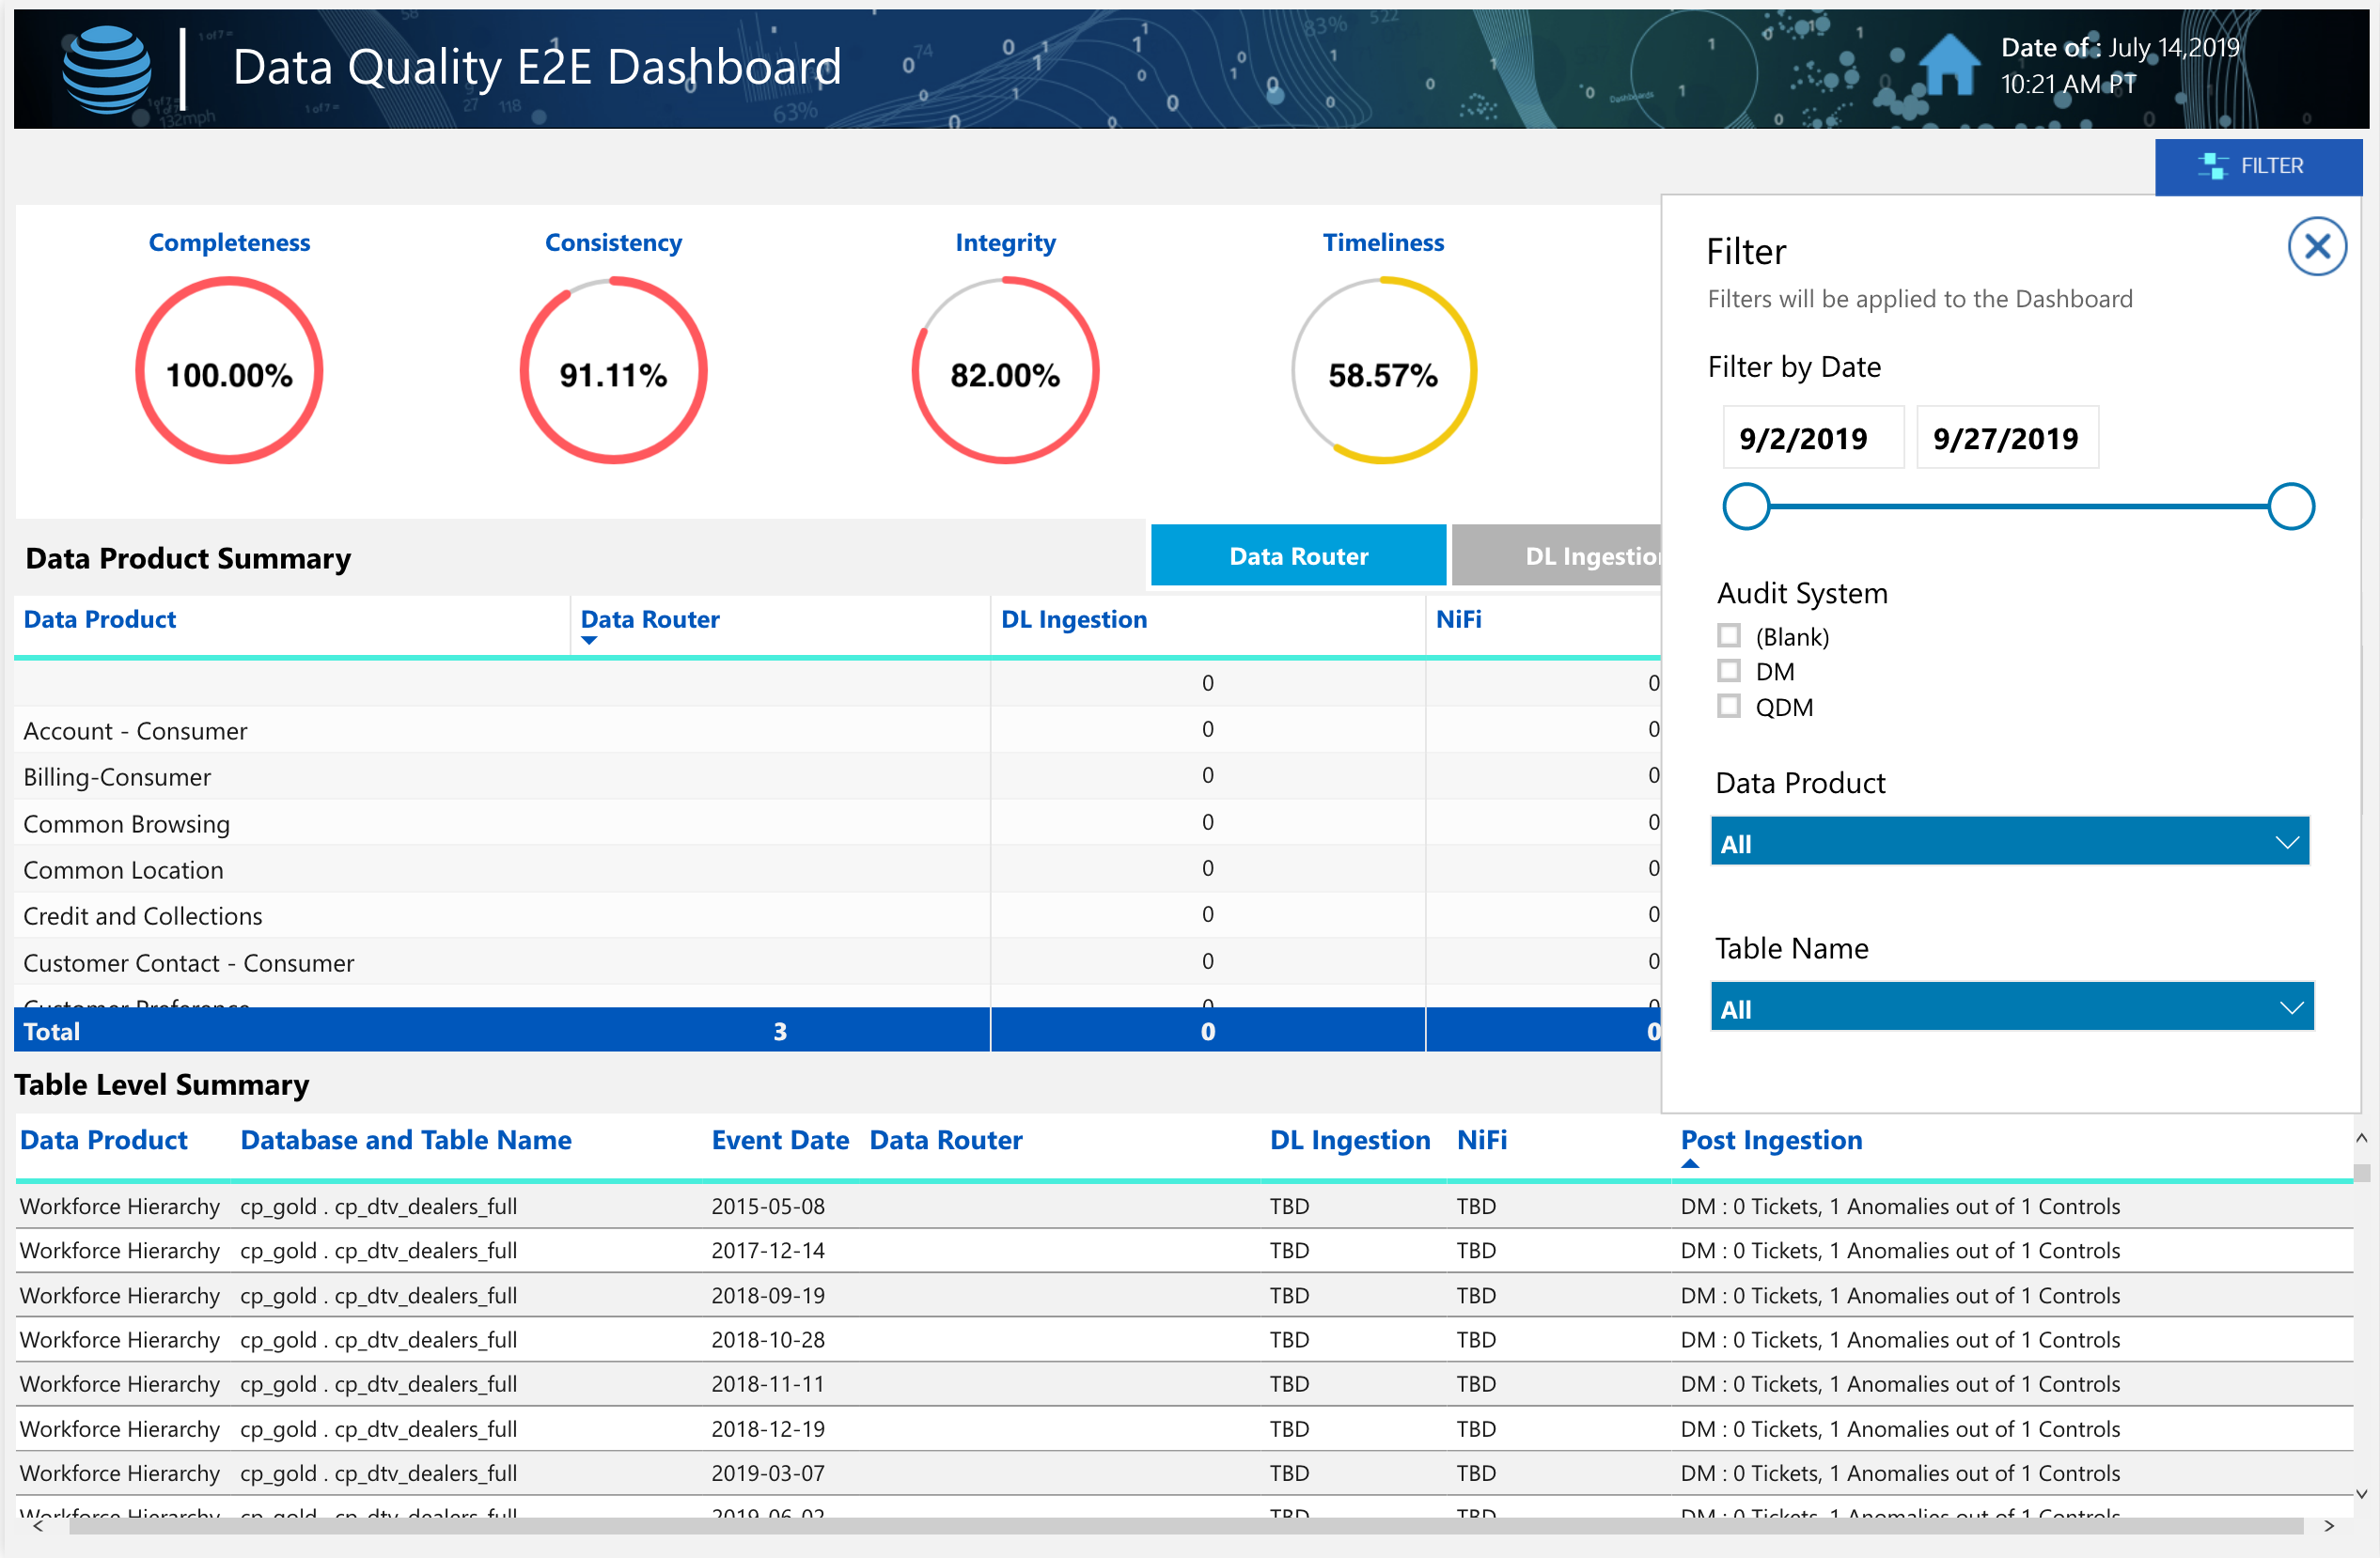
• Lack of Customization: Users could not tailor their dashboards to their unique needs.

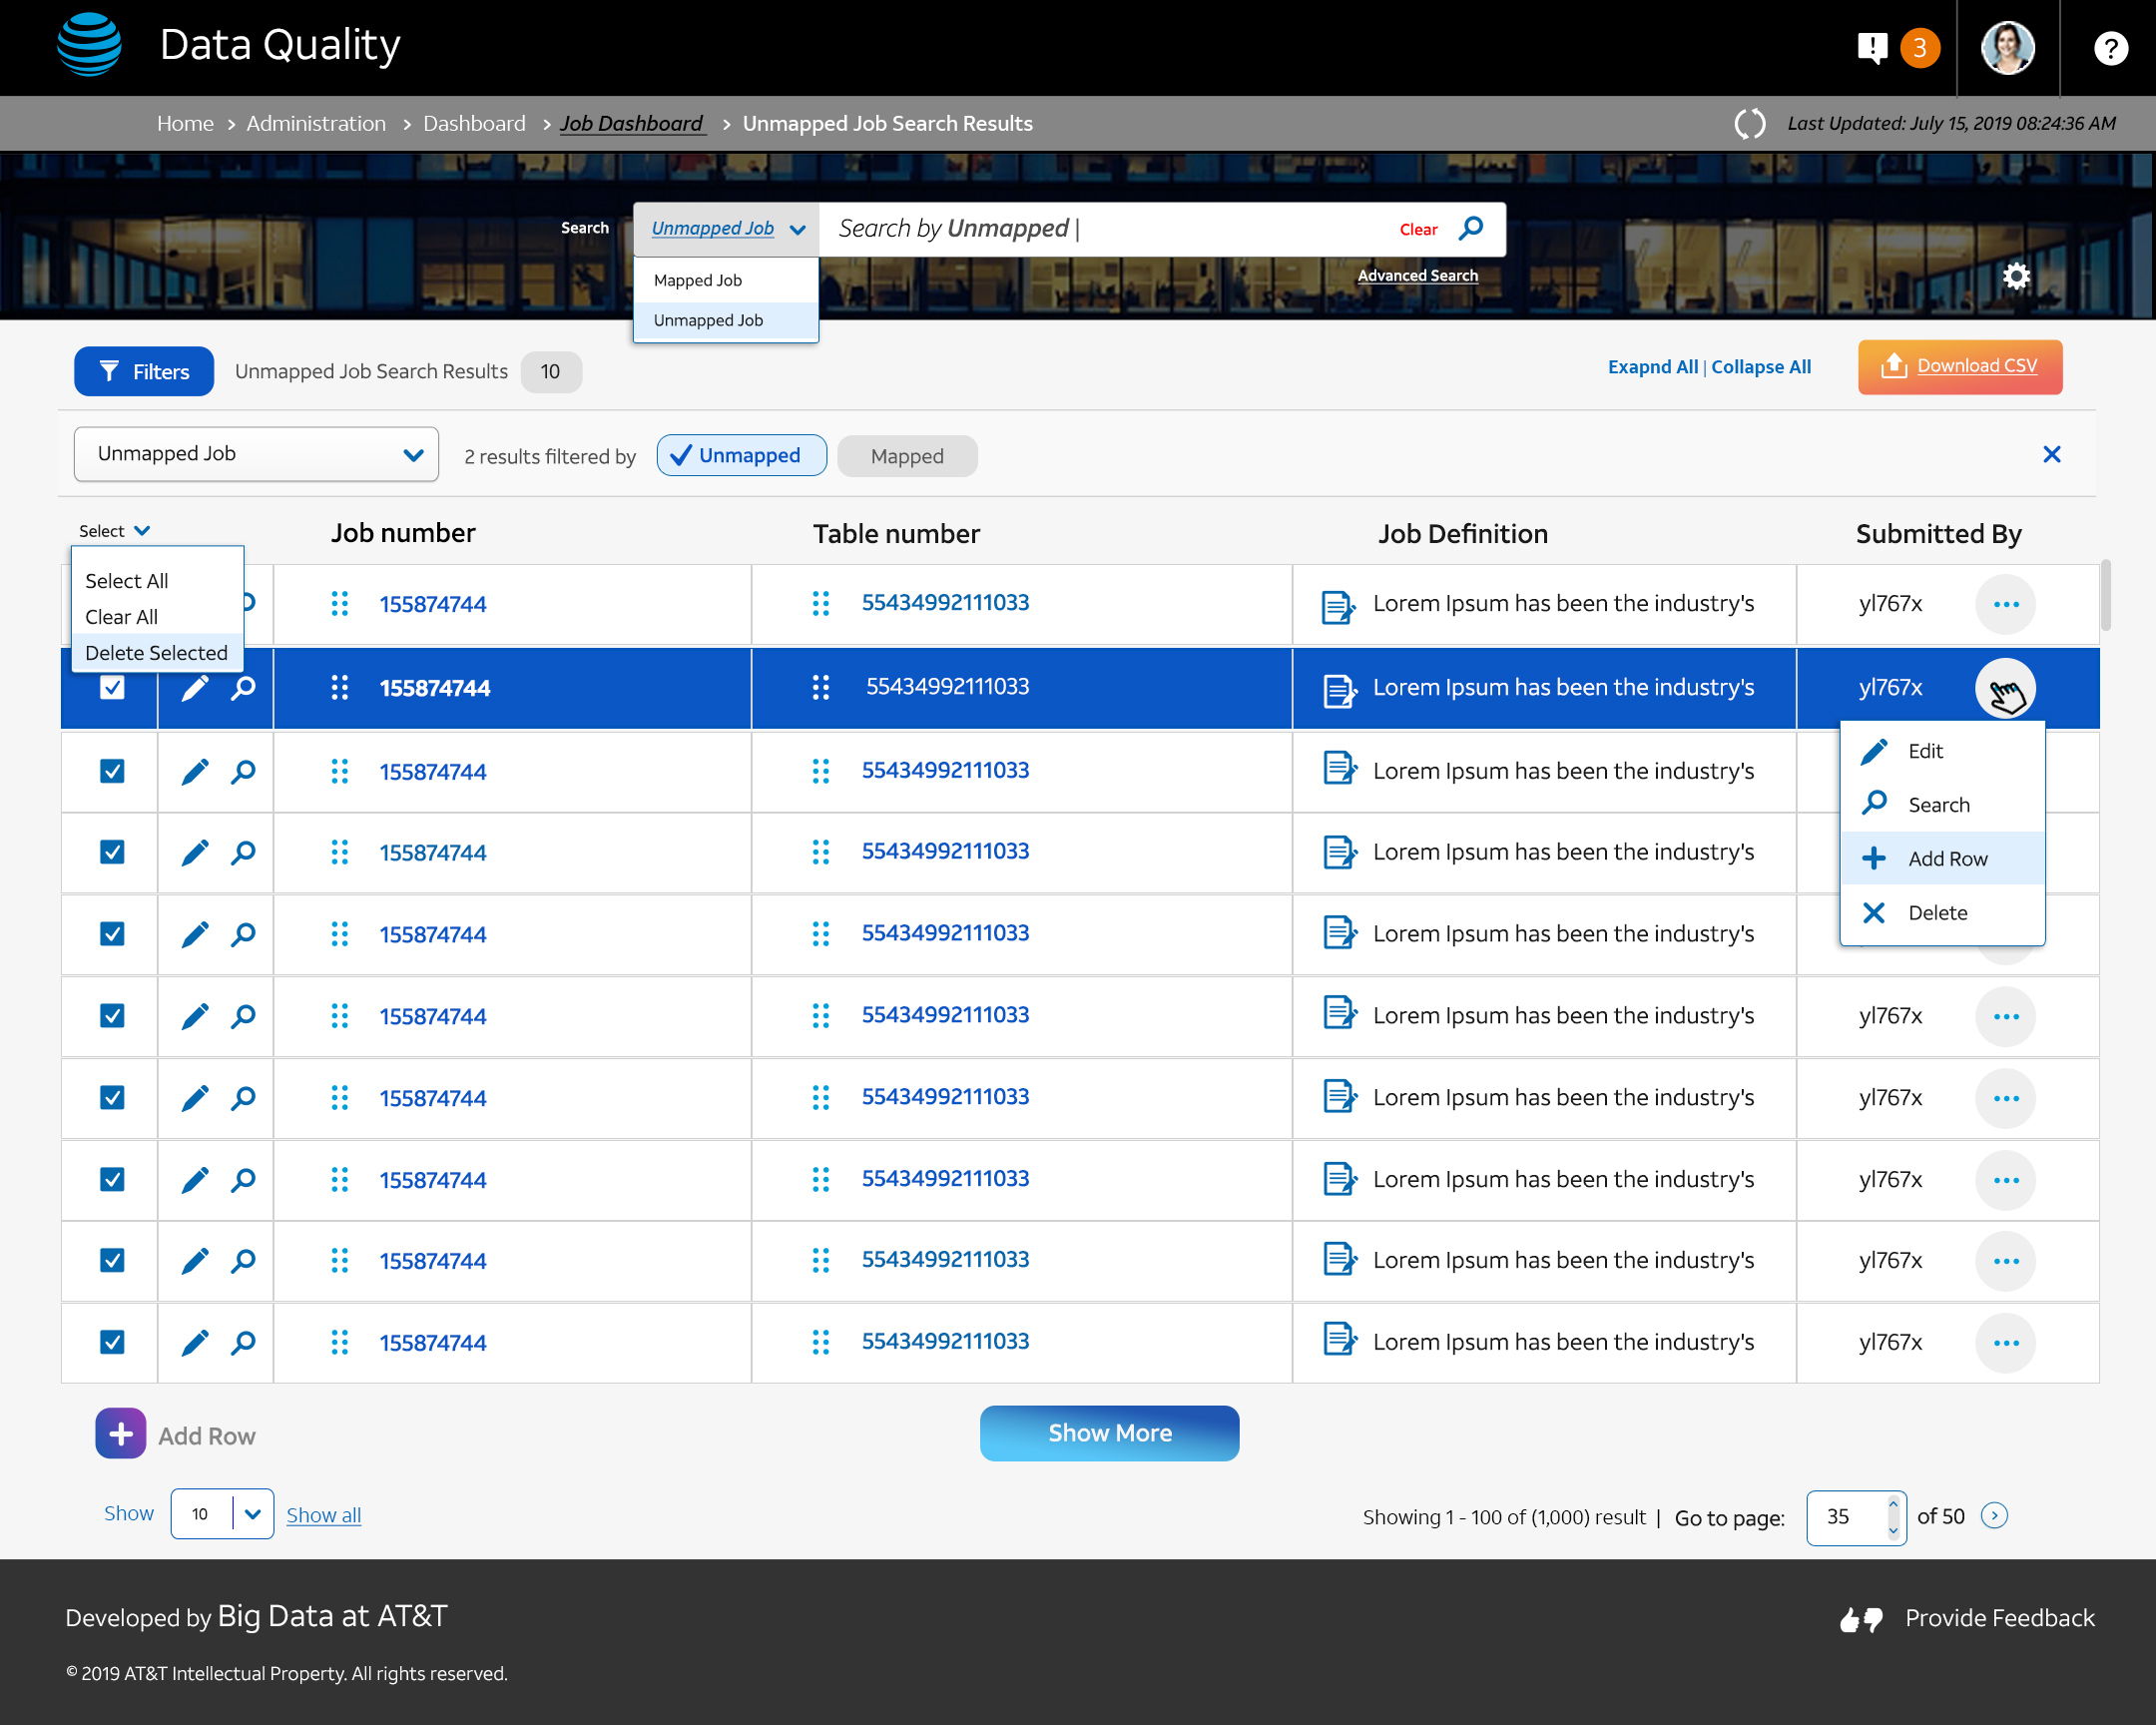
Collaborating with the Chief Data Officer (CDO), I defined a new vision focused on:

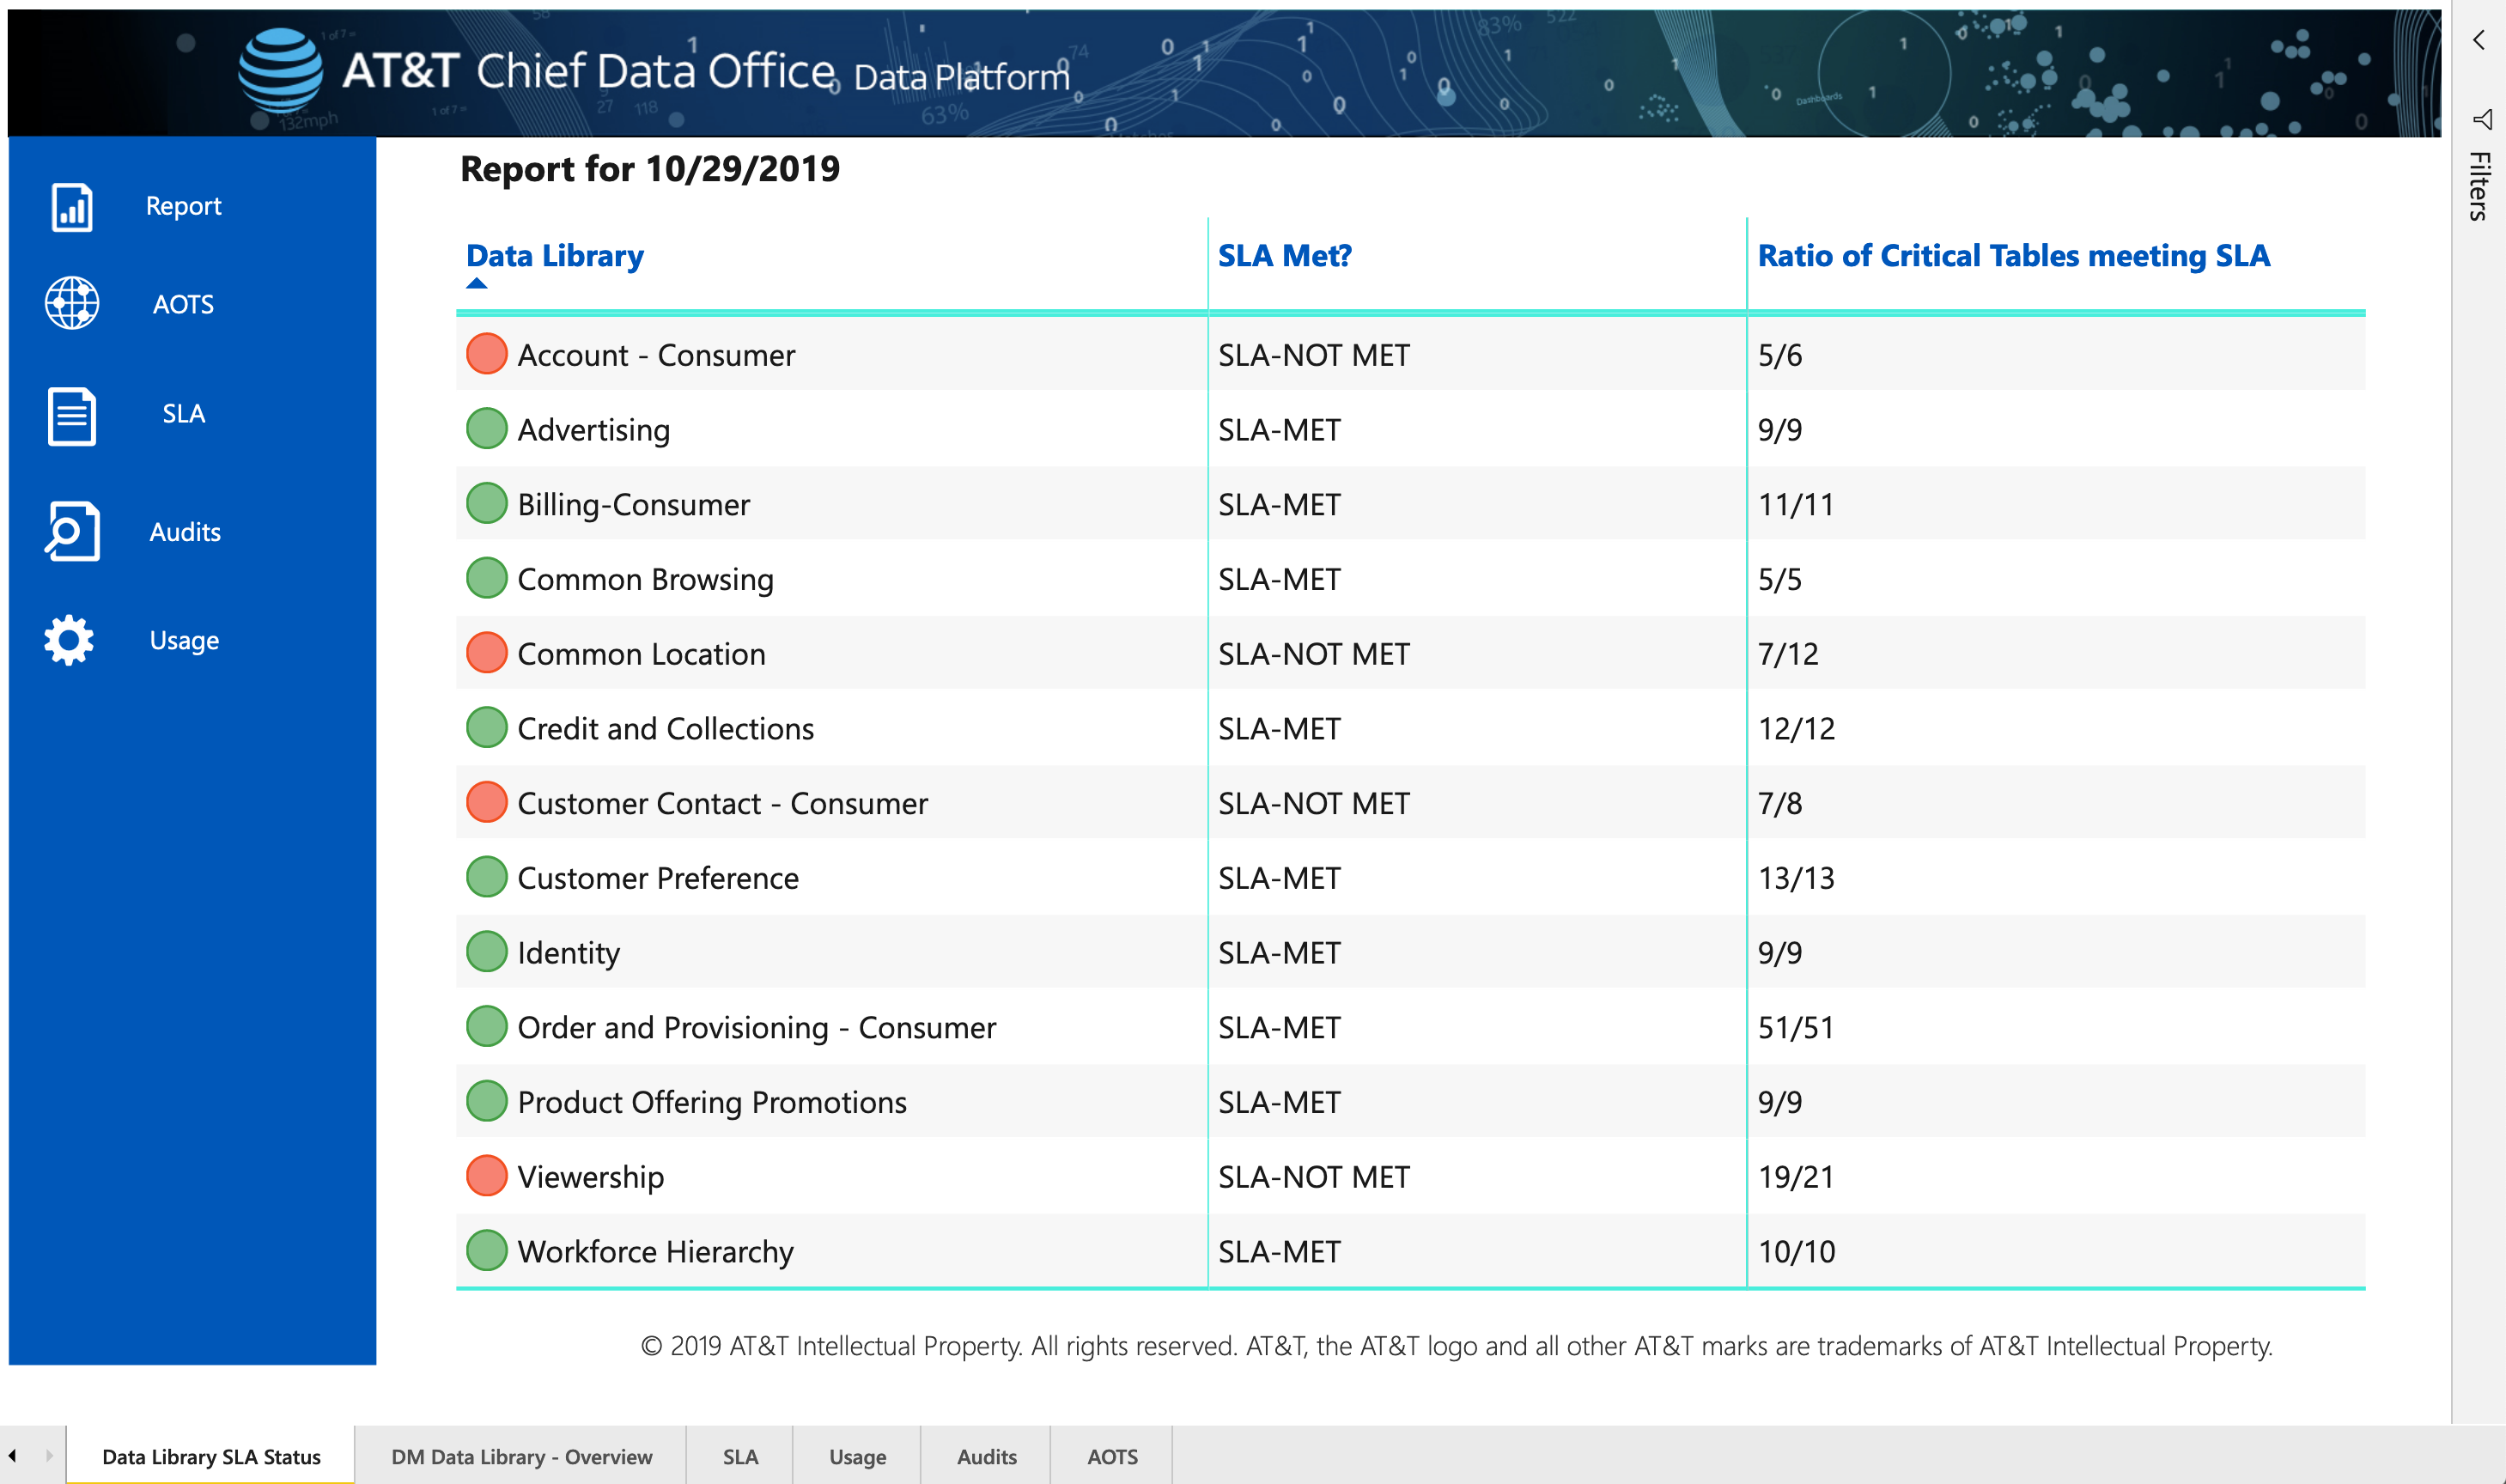
• Simplification: Streamlining navigation and user experience to reduce cognitive load.

• Customization: Allowing personalized dashboard views tailored to users" roles and priorities.

• Improved Data Visualization: Clarifying and enhancing the presentation of data insights.

team member

E2E DQ Dashboard


team member

E2E DQ Report


Leadership in Cross-Functional Collaboration

This project required extensive collaboration across multiple teams. Key contributions included:

• Team Leadership: I led a cross-functional team of 15, coordinating weekly check-ins, design reviews, and ensuring alignment on business goals and technical feasibility.

• Stakeholder Engagement: Regular updates and feedback sessions with business and executive stakeholders ensured transparency and iterative design adjustments.


Design Strategy & Process

I employed a user-centered design process to deliver a scalable and intuitive solution.

• User Research: Conducted over 20 interviews with internal stakeholders (data analysts, managers, and executives) to identify workflow inefficiencies and pain points.


• Prototyping & Testing:Created wireframes and high-fidelity prototypes using Figma. Conducted A/B testing and usability studies to iterate on designs based on user feedback. Partnered with data engineering to ensure technical scalability.

• Customization & Personalization: Introduced personalized dashboard views, enabling users to prioritize relevant data and insights based on their specific roles.

E2E DQ Dashboard

team member

team member

team member

team member

E2E DQ Report

team member

team member

team member

team member

team member

team member

Driving Business Outcomes

The redesign yielded measurable and impactful results:

• 35% Reduction in Decision-Making Time: Streamlined navigation and improved visualizations empowered users to make decisions faster.


• 40% Increase in User Engagement: Enhanced usability and customization features encouraged users to interact more with the dashboard.


• $2M Annual Cost Savings: Reduced reliance on manual checks allowed teams to focus on strategic initiatives, improving overall efficiency.


• 15% Increase in Data Accuracy: Clearer data visualizations and improved workflows enabled users to identify and address quality issues more effectively.

Key Takeaways

• Strategic Alignment: The redesign supported AT&T’s broader digital transformation goals by improving operational efficiency and driving better decision-making.

• Cross-Functional Collaboration: Successfully managed a multi-disciplinary team, ensuring alignment and timely execution of deliverables.


• User-Centered Design: By addressing user needs through a tailored and intuitive dashboard, the project delivered a solution that balanced usability, scalability, and business impact.


E2E IOS Mobile


E2E DQ Job Search


Works

Works

image
Product, Behind the scene

DIRECTV

Product Enhancements

Case Study
image
Enhanced Decision-Making

AT&T

Business Challenge & Vision

Case Study
image
End of End

Data Quality

Right Information at the Right Time

Case Study

get in touch

Contact Me

Let"s Jump In!