person

Designing BI Dashboard for Enhanced Decision-Making at AT&T

Role: Head Product Designer
Company: AT&T Chief Data Office
Duration: February 2020 - July 2024
Tools: Tableau, Power BI, Figma, JIRA, UserTesting
Team: Product Managers, Data Engineers, UX/UI Designers, QA Analysts (12 people total)

Project Overview

AT&T’s internal BI dashboard had become outdated, struggling with performance bottlenecks, poor usability, and a lack of customization options for different business units. The goal was to redesign the dashboard to streamline the decision-making process for various stakeholders (e.g., senior executives, data analysts, product managers), ensuring the dashboard was not only intuitive but also provided actionable insights at a glance.


Strategic Leadership Highlights

Business Challenge & Vision

As the Head Product Designer, I identified that AT&T"s BI dashboard had several user experience issues, including cluttered visualizations, slow performance, and limited interactivity, which were contributing to delayed decision-making. The goal was to redesign the dashboard into a fast, easy-to-use tool that provided stakeholders with meaningful, customizable insights. I worked with cross-functional teams, including business leaders and data engineers, to create a design vision that aligned with AT&T’s business objectives of improving data literacy and fostering a culture of data-driven decision-making.


team member

Leadership in Cross-Functional Collaboration

• Team Leadership: Led a cross-functional team of 12 professionals, including data engineers, product managers, and UX/UI designers. I facilitated weekly meetings to align on design goals, ensuring that both business and technical teams were on the same page.

• Stakeholder Engagement: I regularly engaged with business stakeholders to understand their needs and pain points, iterating on the design based on their feedback. This collaboration helped me balance technical feasibility with user requirements, ensuring that the final product was both effective and aligned with AT&T’s goals.

Design Strategy & Process

• User-Centered Design: Conducted user interviews with 30+ internal users from various business units to identify pain points in the current dashboard and prioritize features. This input helped us design a more intuitive user interface with tailored views for different departments.

• Prototyping & Testing: Created wireframes and interactive prototypes using Figma. I worked closely with QA analysts to conduct A/B testing, gathering data on which design features performed best in terms of usability and engagement.


• Customization & Personalization: Developed a system that allowed users to customize dashboard views based on their specific role and needs. This personalization enabled users to focus on the data that mattered most to them, improving efficiency across departments.

• Performance & Scalability: Collaborated with data engineers to ensure the dashboard"s performance was optimized for large datasets, ensuring that the new design could handle AT&T"s big data scale without sacrificing speed or functionality.


team member

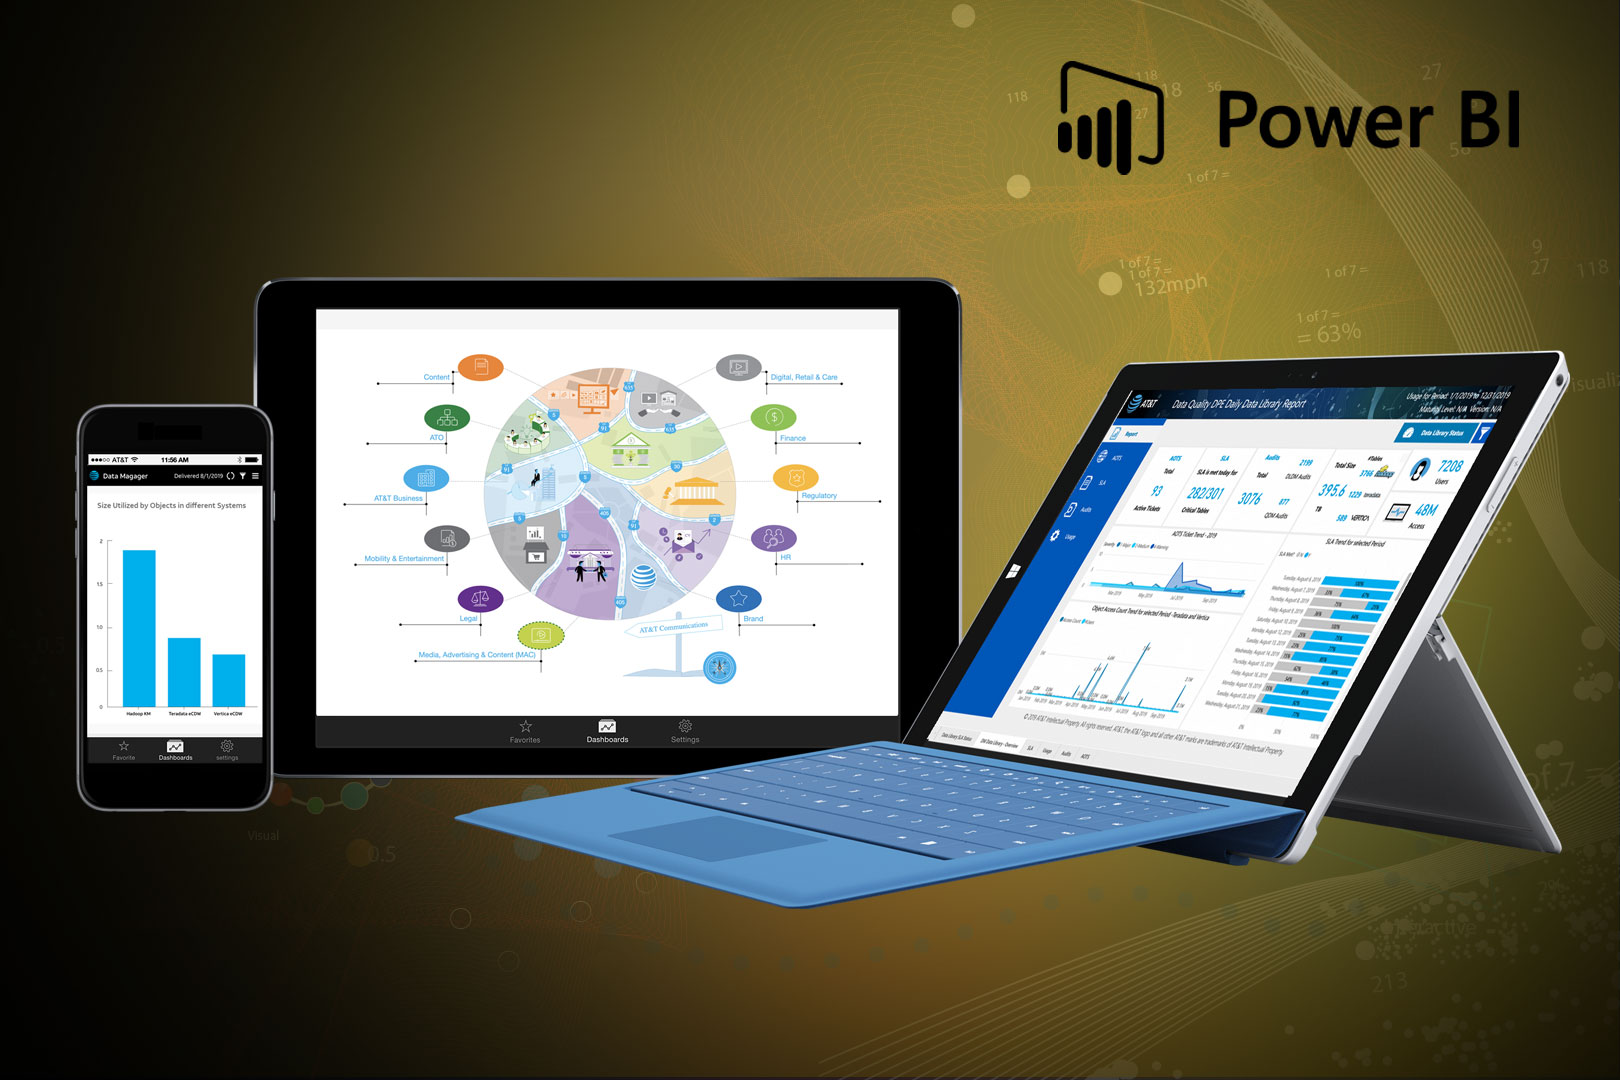
AT&T Communication Project


team member

End to End Data Quality


Driving Business Outcomes

• Improved Decision-Making Efficiency: The redesigned dashboard reduced decision-making time by 40%, helping AT&T’s leadership and data teams make faster, more informed decisions.

• Increased User Adoption: Post-launch user adoption increased by 50%, driven by a more intuitive interface and features like role-based customization and real-time data updates.


• Cost Savings: By reducing manual data processing and improving data accuracy, the redesign helped save AT&T approximately $1.5M annually.

• Data Accuracy & Actionability:Data accuracy improved by 18%, as the new design enabled users to identify discrepancies more quickly, leading to better data governance and reduced errors in reporting.


team member

Self Service Usage


team member

AMP Tools Usage


Key Takeaways

• Strategic Alignment: This project demonstrates how design decisions can be aligned with broader business goals, particularly the goal of fostering a data-driven culture at AT&T.

• Cross-Functional Collaboration: The case study shows strong leadership in managing complex, multi-disciplinary teams, ensuring the project met both user and business needs.


• Quantifiable Business Impact: Success was measured not only by user feedback but also by key business metrics like decision-making efficiency, user adoption, and cost savings. Success was measured not only by user feedback but also by key business metrics like decision-making efficiency, user adoption, and cost savings.

• User-Centered Design: The redesign emphasized a user-centered design approach, ensuring the final product met the needs of various stakeholders while also addressing technical and performance requirements.


team member

AI-Powered Ask Platform


team member

Full Design Life Cycle


Works

Works

image
Product, Behind the scene

DIRECTV

Product Enhancements

Case Study
image
Enhanced Decision-Making

AT&T

Business Challenge & Vision

Case Study
image
End of End

Data Quality

Right Information at the Right Time

Case Study
image
AT&T Chief Data Office

AI-Driven Platform

Ask AT&T Platform

Case Study

get in touch

Contact Me

Let"s Jump In!